6/2026 What if?
Welcome to the June edition of my Market Newsletter. I keep finding there’s an abundance of noise and confusion in the financial markets, and most Americans don’t know how to cut through the noise and get the data they are really looking for to make informed decisions. Because of this, I’ve created this newsletter, where each month I put together a summary of thinking’s to help educate long-term decisions. With that said, let’s get to it!
Disclaimer: Because of the increased regulation and compliance in the financial industry, I want to start with saying everything in this newsletter is based on my opinion, is not predictive in any way. Also, I used AI to assist in rewriting my newsletter to reduce grammatical errors and to improve syntax.
————————————————————-
This past month, I sat down with a client who asked a very real, incredibly authentic question.
They looked at me and asked: "What if we’re wrong about the future? What if the economy collapses? What if the current government and administration send us into World War III or complete and utter economic ruin? If that happens, what happens to our livelihood, our investments, and our families? What if?"
Can you relate to that fear? I know I can.
It is sobering to think about—scary, even. If the American democratic experiment were to fail, what then? Who survives, who falls behind, and what happens to the world left in the wake?
It leads to the ultimate question we face in wealth management: Is your money safe if complete global economic ruin occurs?
The honest answer is no.
But it’s important to understand the nuance here: if a true, permanent global collapse happens, no asset class will save you. Not gold, not physical real estate, not Bitcoin, and not cash under a mattress. In a total collapse scenario, the financial system itself ceases to exist, and the economy reverts to a barter system based on basic survival goods.
I’ll admit, it’s depressing to even write those words. But I want to address it because it is an honest, human fear. Let’s just sit with that reality for a moment.
Throughout human history, progress has never been a straight line. We would all love a steady, consistent, upward-sloping chart of prosperity, but that’s simply not how the world works. History is a messy story of two steps forward and one step back.
So, what do we do with this reality?
We are left with a fundamental choice. Do we embrace structural pessimism and go down the dark rabbit hole of the ultimate "what if"? Or do we embrace structural optimism—the belief that despite human error and massive crises, the world will continue to innovate, advance, and leave future generations better off than the present?
Each person must arrive at their own conclusion.
If you choose the first option—pessimism—the most logical next step would be to close your investment accounts, build a secure bunker, and stock up on supplies. No one can prove whether you will ultimately be right or wrong, though everyone deeply hopes you are wrong.
But if you choose the second option—optimism—I encourage you to lean into the long-term data. When you look past the daily news cycle and look at the multi-decade and multi-century trends, the case for human progress is overwhelming:
· Human Welfare: Over the last 200 years, the global extreme poverty rate has plummeted from roughly 80% to under 10%, while global literacy has risen from 12% to over 86% (Source: World Bank / Our World in Data).
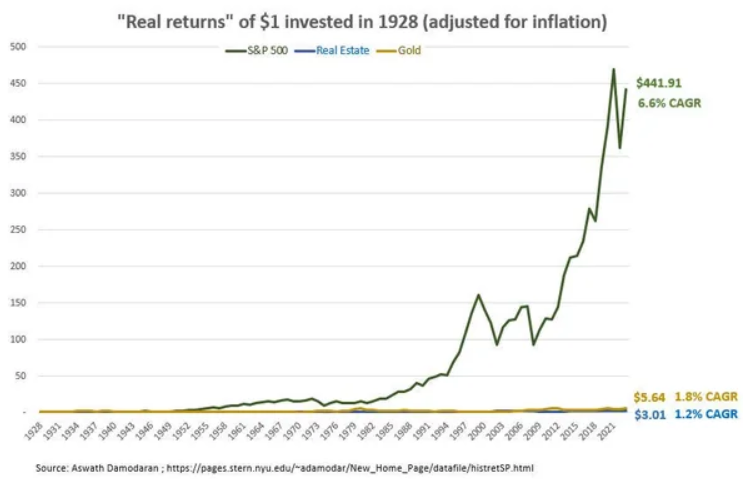
· Purchasing Power: According to historical market data, U.S. equities have delivered an average inflation-adjusted real return of roughly 6.5% to 7% (before inflation is close to 10% per year) per year over the last two centuries, surviving the Civil War, the Great Depression, and two World Wars (Source: Stocks for the Long Run).
· Dividend Growth: Dividend growth has outpaced inflation (CPI) in almost every single decade since World War II, meaning the cash flow generated by great companies naturally protects your purchasing power over time (Source: Hartford Funds).
The chart below illustrates this enduring resilience. It tracks the real, inflation-adjusted return of a single dollar invested over the long term, demonstrating how equities have consistently overcome short-term crises to reward long-term optimists.
This historical resilience is exactly why we build a tailored financial plan and a diversified investment portfolio specific to you.
If you are asking me where I stand, I am an unrepentant optimist. We cannot control or perfectly predict the future, but we can intelligently prepare for it. This is why creating a specific financial and retirement income plan is so critical; it dictates your investment strategy. When the next crisis du jour inevitably hits, we don't have to panic or wonder what to do—we simply execute the long-term plan we already built for it.
If you are a client of Hobbs Wealth Management and you aren't feeling fully confident in your long-term strategy right now, please reach out to me immediately. And if you aren't currently a client but want that same level of confidence in your financial future, reach out as well. You deserve to face the future with peace of mind.
Additional Data: Each month I get asked by clients what additional resources I’m looking at. Please hear me in stating I’m not trying to predict anything whatsoever, just some of the interesting data I’m watching.
Global Wealth Inequality – According to a research report from the Cato Institute, Global Wealth Inequality is actually reducing. To me, this seems to fly in the face of what I see in the news media. Source: https://www.cato.org/commentary/reality-check-inequality-panic
Consumer Sentiment and Market Returns – US Consumer sentiment was just recorded as the WORST EVER – kind of wild to think this is the case when just thinking about the last 20 years. In any case, when I see information like this, I wonder “What does the market typically do?” Well – Good news! Historically, when sentiment is low, it’s generally a good sign for the broad market. Consider this…
Buying at Peak Sentiment: On average, if you invest in the S&P 500 when consumer sentiment hits a rolling peak (everyone is incredibly optimistic), the average return over the next 12 months is roughly 4.1%.
Buying at Trough Sentiment: If you invest in the S&P 500 when consumer sentiment hits a rolling trough (everyone is miserable), the average return over the next 12 months is 24.1%
Sourced from: https://awealthofcommonsense.com/2026/05/the-lowest-consumer-sentiment-ever/
Breakeven Inflation Rate - 5-Year Breakeven inflation rate is now 2.48%. You better believe this is going to garner significant attention by the Federal Reserve and the incoming Fed President. I’m curious to see what happens in the next few months.
Debt Interest Payments – Most in this country would agree that the Federal Debt is just too high, but did you realize that the interest payments on this debt is now just over 1.2 trillion a year? What should we do about it? My guess is we should balance the government budget…. But no one is asking me.
In closing: We of course cannot control what the market does from here and we cannot predict when the next market downturn will occur. But we can control our behavior to these outside events and continue to stick with our long-term investment strategy.
As always, thank you for your trust. If you have any questions/concerns, please contact me. If you found this useful, please share with someone you care about.
-Dave
David Hobbs, CFP®
Wealth Advisor | Owner
Hobbs Wealth Management
Past performance may not be indicative of future results. Investing in securities involves risks, including the potential for loss of principal. There is no guarantee that any investment plan or strategy will be successful.
Standard & Poor’s 500 (S&P 500) - a market-cap weighted index composed of the common stocks of 500 leading companies in leading industries of the U.S. economy.
Russell 2000 – The index measures the performance of the small-cap segment of the US equity universe. It is a subset of the Russell 3000 and includes approximately 2000 of the smallest securities based on a combination of their market cap and current index membership.
MSCI ACWI ex USA – The index measures the performance of the large and mid-cap segments of the particular regions, excluding USA equity securities, including developed and emerging markets. It is free float-adjusted market-capitalization weighted.
Federal Funds Rate - refers to the target interest rate set by the Federal Open Market Committee (FOMC). This target is the rate at which commercial banks borrow and lend their excess reserves to each other overnight.
This report was prepared by Hobbs Wealth Management, a State registered investment adviser under the Investment Advisers Act of 1940. Registration as an investment adviser does not imply a certain level of skill or training. The oral and written communications of an adviser provide you with information about which you determine to hire or retain an adviser. Neither the information nor any opinion expressed it so be construed as solicitation to buy or sell a security of personalized investment, tax, or legal advice. For more information please visit: https://adviserinfo.sec.gov/ and search for our firm name.
This newsletter is prepared to provide a degree of insight into the analysis used by Hobbs Wealth Management to make investment decisions. It is not a complete description of all the factors used by Hobbs Wealth Management to make decisions on behalf of clients. The opinions included are not intended to be taken as fact but are Hobbs Wealth Management’s interpretation of the impact of external events on investments.
The information herein was obtained from various sources. Hobbs Wealth Management does not guarantee the accuracy or completeness of information provided by third parties. The information in this report is given as of the date indicated and is believed to be reliable. Hobbs Wealth Management assumes no obligation to update this information, or to advise on further developments relating to it.
This article contains external links directing you to a third-party website. Although we have reviewed the website prior to creating the link, we are not responsible for the content of the site.
An index is an unmanaged portfolio of specific securities, the performance of which is often used as a benchmark in judging the relative performance of certain asset classes. Investors cannot invest directly in an index. An index does not charge management fees or brokerage expenses, and no such fees or expenses were deducted from the performance shown.
The mention of specific securities and sectors illustrates the application of our investment approach only and is not to be considered a recommendation. The specific securities identified and described herein do not represent all of the securities purchased or sold for the portfolio, and it should not be assumed that investment in these securities was or will be profitable. There is no assurance that the securities purchased remain in the portfolio, or that securities sold have not been repurchased. For a complete list of holdings, please contact your portfolio advisor.
Hobbs Wealth Management may discuss and display charts, graphs, formulas, stock and sector picks which are not intended to be used by themselves to determine which securities to buy or sell, or when to buy or sell them. This specific information is limited and should not be used on their own to make investment decisions. This information is offered as educational only.