5/2026 Never Interrupt Compounding
Welcome to the May edition of my Market Newsletter. I keep finding there’s an abundance of noise and confusion in the financial markets, and most Americans don’t know how to cut through the noise and get the data they are really looking for to make informed decisions. Because of this, I’ve created this newsletter, where each month I put together a summary of thinking’s to help educate long-term decisions. With that said, let’s get to it!
Disclaimer: Because of the increased regulation and compliance in the financial industry, I want to start with saying everything in this newsletter is based on my opinion, is not predictive in any way. Also – I used AI to assist in rewriting my newsletter to reduce grammatical errors and to improve syntax.
Full written article below with sources.
On Monday, March 30th, the S&P 500 was down about 9% from the peak earlier in the year. In the investment world, a 10% decline in market values is considered a correction, to me, 9% is close enough to a “correction” to call it one.
Also, why do we call it a correction? To me, let’s just call it as it is, the market went down 10% and it was noticeable. In any case…
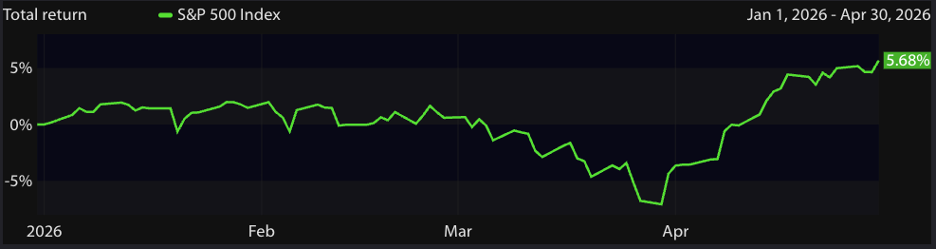
I’m not sure if it’s just me, but it seems as though it’s hard to remember just 30 days ago. Do you remember the news headlines? The idea was, “There’s no end in sight!”
Well… it seems the concern from last month has reversed course. I’ve yet to find a crystal ball that works so we’ll have to see how this all pans out in a year or two.
Even with this decline of close to 9-10%, I want to remind everyone of that we were still about 5% away from the annual average decline of 14.2% as cited by JP Morgan. This decline is just another regular reminder that the markets cannot be timed.
I, like you, HATE when the markets decline and when I read the headlines, I too get scared, truly! But every time we go through a market decline and subsequent recovery, I get reminded of the time tested historical truths that we must remain goal-focused, plan-driven, long-term investors.
I recently heard the average holding time for a stock is 5 months, which sounds foolish to me! One of the most successful investors of all time was Warren Buffett’s late partner, Charlie Munger, who famously shared “The first rule of compounding: Never interrupt it unnecessarily.” So for all the day-traders out there who are holding stocks for 5 months, 5 days, or 5 minutes… good luck.
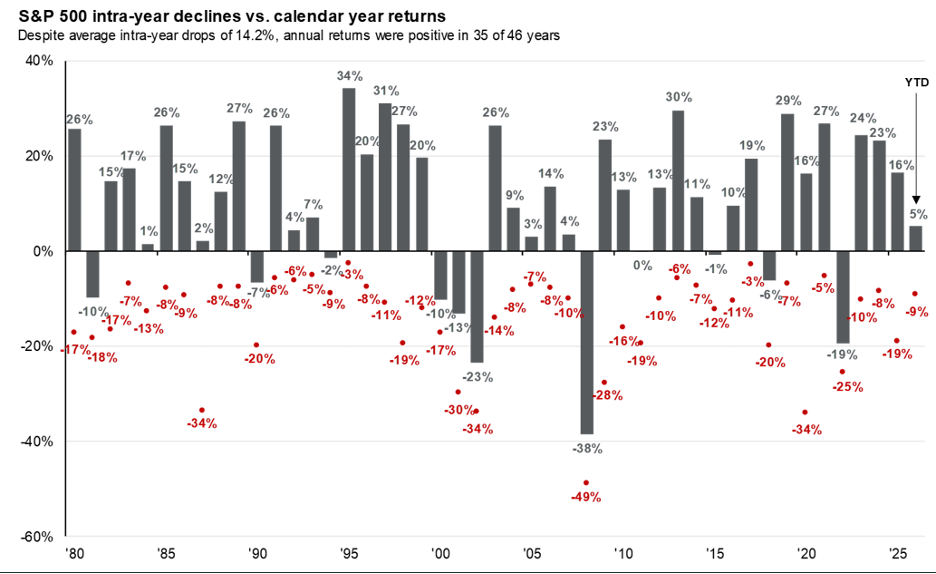
Annual returns and intra-year declines: this chart shows the price return and maximum drawdown of the S&P 500 in each year since 1980. Despite significant intra-year declines, the S&P500 has finished the majority of years with positive returns, encouraging investors to stay the course.
Slide sources and disclaimers
Source: FactSet, Standard & Poor’s, J.P. Morgan Asset Management. Returns are based on price index only and do not include dividends. Intra-year drops refers to the largest peak-to-trough decline during the year. returns shown are calendar year returns from 1980 to 2025, over which the average annual return was 10.7%. Past performance is no guarantee of future results.
Guide to the Markets - U.S. Data are as of April 30, 2026.
To add to this point, someone recently sent me a study completed from NorthWestern Mutual over the past 18 years, results here, there were two eye-popping statistics that may resonate with you.
39% of Americans say they are investing in high-risk positions like crypto, currencies, prediction markets, meme stocks, sports betting
73% of these Americans say they are doing so because they feel financially behind and believe those positions could help them reach their goals faster than other approaches.
Do you feel this way? Do you feel you’re behind and feel like the best course is to put your money into these type of products?
If you do, I get it, we all want to feel financially secure, including me. If you go down the before-mentioned road, I do wish you the best of luck, truly. However, I have a great amount of concern this will not work out in your favor. What’s more, I fully believe there is a better, and easier, and simpler, and more time-tested way to “catch-up.”
Remember that quote above from Charlie Munger? The one about compounding? Over the year, the broad markets have been a compounding machine! Compounded returns are easy to say you understand, but if I’m being honest, even I don’t full get it.
Let me explain…
Based on historical returns, if someone invested $1,000 in the S&P 500 in an IRA back in 1993 and held it to this year, you’d have close to 2.3mil.
Same as the above, but let’s say you started 10 years earlier and started with that 1k in 1983, you’d have close to 7.2mil. Do you follow this? Just holding for 10 extra years provided about 5mil more in assets!
Last time here… same idea but now you put your 1k from your IRA in the S&P 500 starting in 1973… wait for it…. You’d have a whopping 28mil! Is it just me, or do these numbers just get wild??? Holding the money for 20 extra years, created about 10x in additional wealth.
So for everyone feeling like they are behind, I get it, life is hard, work is toil, nothing seems to be fair. But be encouraged because using history as a guide, it seems that it’s not how much you invest, it’s how long you invest.
Which brings me to the final idea I want to share this month. This is a continuation of Charlie Munger’s quote above…Warren Buffett is a unique example of “never stop compounding.” If I were to ask you a question, what percent of Warren Buffett’s wealth occurred after the age of 65, his normal retirement age? What percentage growth would you guess? 50%-70%?? Those would be good guesses. It surprised me to learn that 98% of Warren Buffett’s wealth occurred after the age of 65. Wild!
What’s the take-away from this statistic? A lot of folks will just comment about the increase in Buffett’s overall wealth. To me, the take-away is the importance of engaging in valuable work, that you enjoy doing, and doing that valuable work for as long as you enjoy doing it. Warren is one of the people who never seemed to “work” a day in his life because he loved his role at Berkshire Hathaway.
Additional Data: Each month I get asked by clients what additional resources I’m looking at. Please hear me in stating I’m not trying to predict anything whatsoever, just some of the interesting data I’m watching.
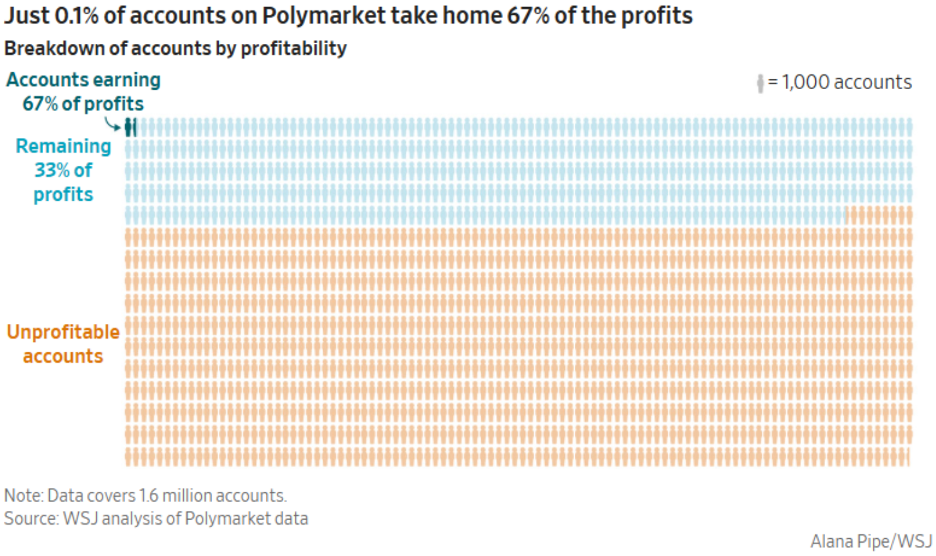
Polymarket Profits – If you aren’t aware, Polymarket is a “prediction market” – like one of the items cited from the Northwestern Mutual survey above. The idea of these prediction markets is that you make a bet that something will occur. After looking at this chart, to me, it sure looks like some insider trading may be occurring with this group.
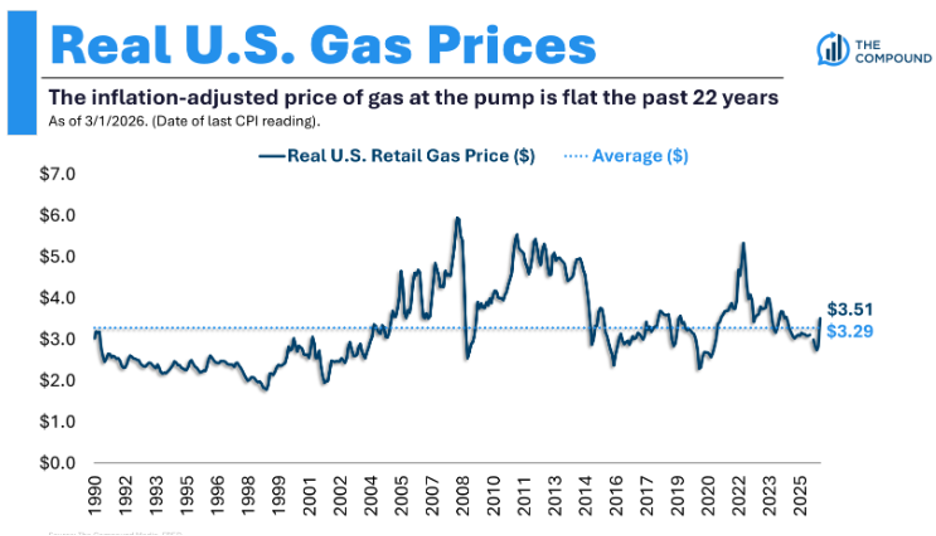
Gas Prices – We’ve all seen the very sudden increase in gas prices at the pump. I saw this chart showing gas prices indexed for inflation. So while none of us like the prices we’re seeing at the pump and can vividly remember what we used to pay when we first started driving (For me it was $.79/gallon!!)…it’s always good to put any data in context.
Breakeven Inflation Rate - 5-Year Breakeven inflation rate is now 2.72%. This has just recently started to tick higher since the start of the year. You better believe this is going to garner significant attention by the Federal Reserve and the incoming Fed President.
Debt Interest Payments – Most in this country would agree that the Federal Debt is just too high, but did you realize that the interest payments on this debt is now just under 1.2 trillion a year? What should we do about it? My guess is we should balance the government budget….but no one is asking me.
In closing: We of course cannot control what the market does from here and we cannot predict when the next market downturn will occur. But we can control our behavior to these outside events and continue to stick with our long-term investment strategy.
As always, thank you for your trust. If you have any questions/concerns, please contact me. If you found this useful, please share with someone you care about.
-Dave
David Hobbs, CFP®
Wealth Advisor | Owner
Hobbs Wealth Management
Past performance may not be indicative of future results. Investing in securities involves risks, including the potential for loss of principal. There is no guarantee that any investment plan or strategy will be successful.
Standard & Poor’s 500 (S&P 500) - a market-cap weighted index composed of the common stocks of 500 leading companies in leading industries of the U.S. economy.
Russell 2000 – The index measures the performance of the small-cap segment of the US equity universe. It is a subset of the Russell 3000 and includes approximately 2000 of the smallest securities based on a combination of their market cap and current index membership.
MSCI ACWI ex USA – The index measures the performance of the large and mid-cap segments of the particular regions, excluding USA equity securities, including developed and emerging markets. It is free float-adjusted market-capitalization weighted.
Federal Funds Rate - refers to the target interest rate set by the Federal Open Market Committee (FOMC). This target is the rate at which commercial banks borrow and lend their excess reserves to each other overnight.
This report was prepared by Hobbs Wealth Management, a State registered investment adviser under the Investment Advisers Act of 1940. Registration as an investment adviser does not imply a certain level of skill or training. The oral and written communications of an adviser provide you with information about which you determine to hire or retain an adviser. Neither the information nor any opinion expressed it so be construed as solicitation to buy or sell a security of personalized investment, tax, or legal advice. For more information please visit: https://adviserinfo.sec.gov/ and search for our firm name.
This newsletter is prepared to provide a degree of insight into the analysis used by Hobbs Wealth Management to make investment decisions. It is not a complete description of all the factors used by Hobbs Wealth Management to make decisions on behalf of clients. The opinions included are not intended to be taken as fact but are Hobbs Wealth Management’s interpretation of the impact of external events on investments.
The information herein was obtained from various sources. Hobbs Wealth Management does not guarantee the accuracy or completeness of information provided by third parties. The information in this report is given as of the date indicated and is believed to be reliable. Hobbs Wealth Management assumes no obligation to update this information, or to advise on further developments relating to it.
This article contains external links directing you to a third-party website. Although we have reviewed the website prior to creating the link, we are not responsible for the content of the site.
An index is an unmanaged portfolio of specific securities, the performance of which is often used as a benchmark in judging the relative performance of certain asset classes. Investors cannot invest directly in an index. An index does not charge management fees or brokerage expenses, and no such fees or expenses were deducted from the performance shown.
The mention of specific securities and sectors illustrates the application of our investment approach only and is not to be considered a recommendation. The specific securities identified and described herein do not represent all of the securities purchased or sold for the portfolio, and it should not be assumed that investment in these securities was or will be profitable. There is no assurance that the securities purchased remain in the portfolio, or that securities sold have not been repurchased. For a complete list of holdings, please contact your portfolio advisor.
Hobbs Wealth Management may discuss and display charts, graphs, formulas, stock and sector picks which are not intended to be used by themselves to determine which securities to buy or sell, or when to buy or sell them. This specific information is limited and should not be used on their own to make investment decisions. This information is offered as educational only.