4/2026 “No End in Sight”
Welcome to the April edition of my Market Newsletter. I keep finding there’s an abundance of noise and confusion in the financial markets, and most Americans don’t know how to cut through the noise and get the data they are really looking for to make informed decisions. Because of this, I’ve created this newsletter, where each month I put together a summary of thinking’s to help educate long-term decisions. With that said, let’s get to it!
Disclaimer: Because of the increased regulation and compliance in the financial industry, I want to start with saying everything in this newsletter is based on my opinion, is not predictive in any way. Also – I used AI to assist in rewriting my newsletter to reduce grammatical errors and to improve syntax.
Full written article below with sources.
The First Quarter of 2026 has been anything but quiet. If you feel like the headlines are moving faster than the markets can digest them, you aren’t alone. In financial journalism, there is a recurring phrase used to describe periods like this: "No end in sight." It is a phrase designed to spark urgency, and often, a touch of fear. But let’s all take a step back and look at these moments through a different lens. While the world feels like it is undergoing a "tectonic rotation," the focus needs to remain on your specific situation, specific goals, and your specific allocation. I’m going to encourage following a repeatable process.
To understand where we are, we have to look at the sheer volume of "firsts" we’ve witnessed. From a geopolitical standpoint, world events have been incredibly active, bordering on chaotic. We have seen the U.S. military extract the President of Venezuela from his palace, an event that would normally dominate a decade of news, yet it is just one bullet point in a crowded quarter.
Simultaneously, we have seen leadership upheavals in the Middle East and the effective closing of the Strait of Hormuz. The Strait is a global jugular vein for energy helping to transport close to 20% of the world’s gas. Its closure caused oil prices to spike instantly, more globally than in the U.S.
Closer to home, the economic data has been equally surprising. In February, the U.S. economy shed 92,000 jobs. To put that in perspective, the "consensus" forecast from the world's leading economists was a gain of 55,000 jobs. When estimates miss the mark by nearly 150,000 jobs, it’s a humbling reminder: The "experts" are often just as surprised as the rest of us. This is why we don't build plans based on forecasts or outlooks. We build plans based on your specific goals.
Growth vs. Value
One of the most significant internal movements in the market this year hasn't been about a specific war or a job report—it has been about a shift in psychology.
For the last several years, Artificial Intelligence (AI) was viewed as a "technological miracle." It was the rising tide that lifted all boats in the tech sector. However, in the last quarter, that narrative has shifted. In the mind of the market, AI has begun to look more like a problem – something that is difficult to forecast and predict. This is causing some investors to re-evaluate AI’s impact on companies.
This psychological shift triggered a shift from Growth stocks to Value stocks. Growth stocks are companies expected to grow at a rate significantly above the average for the market (think Tech companies), while Value stocks are those that appear to be trading for less than their intrinsic worth (think Utility companies). When the market gets nervous, it tends to stop paying for "future promises" (Growth) and starts looking for "current reality" (Value).
We’ve also seen incredible volatility in silver. The price of silver recently went "parabolic," meaning it rose at an unsustainable, near-vertical rate, before culminating in a one-day 31% decline.
Gold and Bitcoin have also joined in the downward slide like silver.
Just to pile it on - the political landscape is adding to the noise. With the Supreme Court striking down IEEPA tariffs (did you realize it’s been 1 year???) and the first primary contests for the midterm elections kicking off.
The Behavioral Gap: Why Sticking to Your Plan Matters
In times like these, the greatest threat to your wealth isn't the Strait of Hormuz, the price of silver, or a bad jobs report. The greatest threat is the "Behavioral Gap."
The Behavioral Gap is the difference between the returns a market produces and the returns an individual investor actually receives. Why is there a gap? Because when the headlines say "no end in sight," humans are hardwired to do something. We want to flee. We want to "sit on the sidelines" until things "settle down."
But here is the truth: By the time things "settle down," the market has usually already priced in the recovery. If you waited for the news to be good in 2009 or 2020, you missed the most explosive parts of the recovery. At Hobbs Wealth, the "Financial Blueprint" process of building your specific plan is specifically designed to bridge this gap. It is a repeatable process that removes the "crystal ball" from the equation and replaces it with a disciplined strategy.
Our Two Core Principles
When you see headlines about the U.S. potentially acquiring Greenland or the military extracting foreign leaders, it is easy to feel that the "well-worn path" is no longer safe. This is where we return to our two core principles:
1. The world is not ending. This sounds like a cliché, but it is a functional investment philosophy. If the world were truly ending, your asset allocation would be the least of your worries. Since we believe the world will continue to function, we must invest in companies that seek to innovate, sell their products at a profit, and return the profit to the owners of the companies.
2. The global economy is a resilient, advancing machine. It has survived world wars, pandemics, depressions, and historical technological shifts. It has been advancing since long before we were here. Of course none of us know what the next 5-10-50 years will bring, but I do believe there will companies seeking to generate a profit.
Relishing the Responsibility
Money is not the end goal; it is a tool to be acted upon. It represents your hard work, your family’s financial health, and your future financial legacy. That is why we "relish the responsibility" of being your wealth manager.
We don't know exactly where the next spark of global growth will come from. We don't know if the midterm elections will result in a "red wave" or a "blue wave." We don't know if the next jobs report will be a "miss" or a "beat."
What we do know is that a plan built on your goals has historically outperformed a plan built on headlines.
A Final Thought for the Month
If you find yourself lying awake wondering how all the above listed issues/concerns impact your specific plan, know that we have accounted for volatility. We have accounted for the "surprises" that catch the consensus off guard.
We find ourselves in a moment of near-perfect political and geopolitical tension. But these are the moments where the greatest discipline is required. We all must exercise discipline, to filter the noise, and to focus on the long-term advancement of the global economy.
If you have questions about the specific shifts we are seeing in the "Growth vs. Value" space, or if the recent job data has you feeling uneasy, let’s talk. I would love to walk you through the data and confirm how your specific plan is built to handle these current events.
Thank you for the trust; it’s not taken lightly.
Additional Data: Each month I get asked by clients what additional resources I’m looking at. Please hear me in stating I’m not trying to predict anything whatsoever, just some of the interesting data I’m watching.
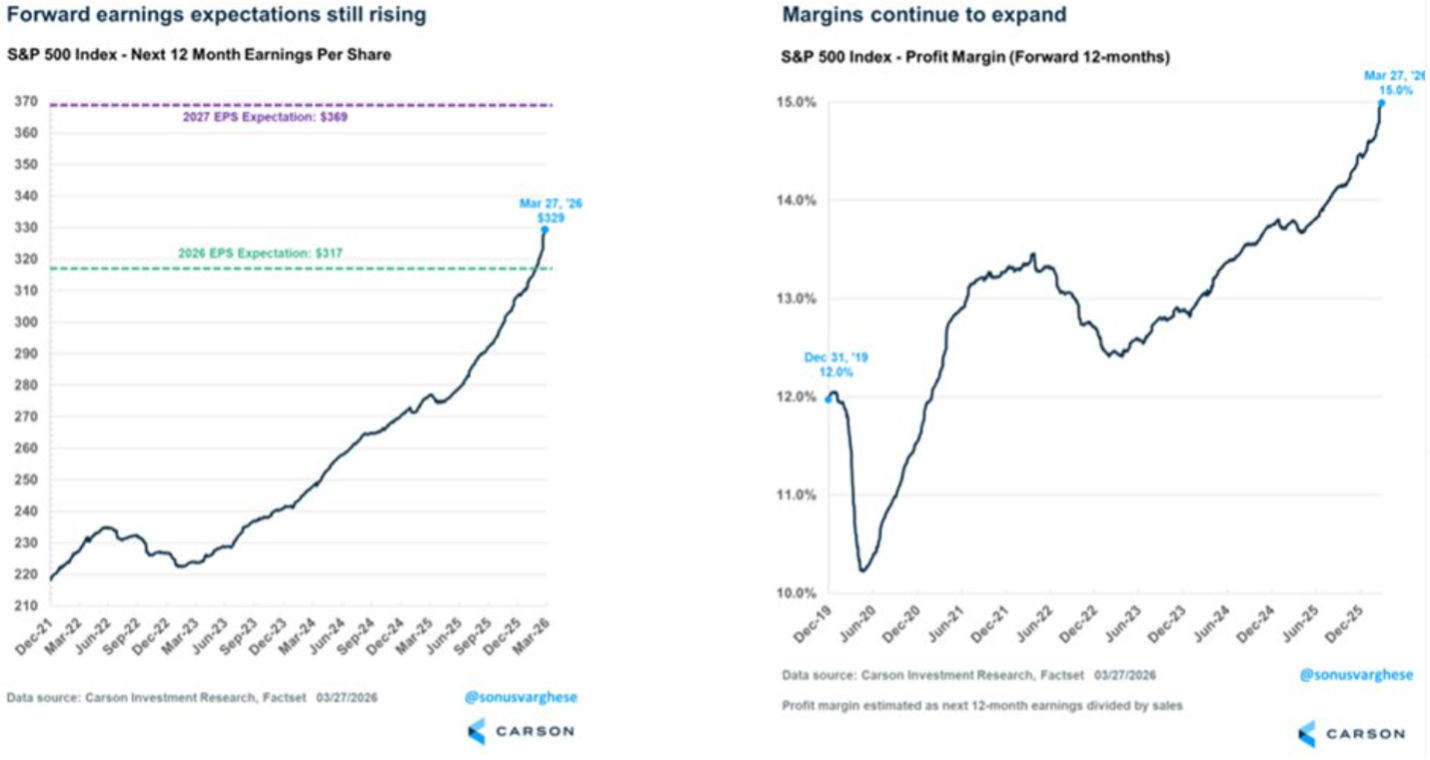
Profit margins and Earnings Per Share continue to climb. This typically doesn’t occur if we’re facing the end of the world…
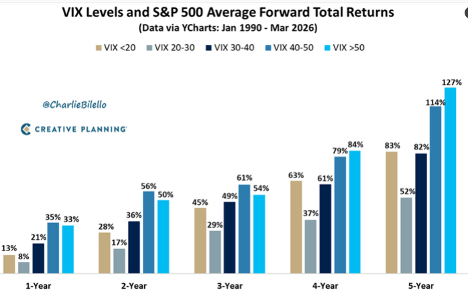
Historically – when the VIX closes above 30 in each of the last two trading days, this level of fear (VIX – Volatility Index) has been associated with above average future stock market returns. Historically, +21% over the next year on average. We’ll have to wait and see if this trend continues.
Breakeven Inflation Rate - 5-Year Breakeven inflation rate is now 2.46%. When you study this chart, you’ll see it goes back to 2004. From this past month, the inflation rate has ticked higher.
Debt Interest Payments – Most in this country would agree that the Federal Debt is just too high, but did you realize that the interest payments on this debt is now just under 1.2 trillion a year? What should we do about it? My guess is we should balance the government budget….but no one is asking me. What’s more, there’s about 3 Trillion in debt to be reissued in 2026 and the broad assumption is that the new interest rates will be quite a bit higher on the reissued debt. So what will this mean? It’ll likely mean even a greater amount of debt interest payments.
In closing: We of course cannot control what the market does from here and we cannot predict when the next market downturn will occur. But we can control our behavior to these outside events and continue to stick with our long-term investment strategy.
As always, thank you for your trust. If you have any questions/concerns, please contact me. If you found this useful, please share with someone you care about.
-Dave
David Hobbs, CFP®
Wealth Advisor | Owner
Hobbs Wealth Management
Past performance may not be indicative of future results. Investing in securities involves risks, including the potential for loss of principal. There is no guarantee that any investment plan or strategy will be successful.
Standard & Poor’s 500 (S&P 500) - a market-cap weighted index composed of the common stocks of 500 leading companies in leading industries of the U.S. economy.
Russell 2000 – The index measures the performance of the small-cap segment of the US equity universe. It is a subset of the Russell 3000 and includes approximately 2000 of the smallest securities based on a combination of their market cap and current index membership.
MSCI ACWI ex USA – The index measures the performance of the large and mid-cap segments of the particular regions, excluding USA equity securities, including developed and emerging markets. It is free float-adjusted market-capitalization weighted.
Federal Funds Rate - refers to the target interest rate set by the Federal Open Market Committee (FOMC). This target is the rate at which commercial banks borrow and lend their excess reserves to each other overnight.
This report was prepared by Hobbs Wealth Management, a State registered investment adviser under the Investment Advisers Act of 1940. Registration as an investment adviser does not imply a certain level of skill or training. The oral and written communications of an adviser provide you with information about which you determine to hire or retain an adviser. Neither the information nor any opinion expressed it so be construed as solicitation to buy or sell a security of personalized investment, tax, or legal advice. For more information please visit: https://adviserinfo.sec.gov/ and search for our firm name.
This newsletter is prepared to provide a degree of insight into the analysis used by Hobbs Wealth Management to make investment decisions. It is not a complete description of all the factors used by Hobbs Wealth Management to make decisions on behalf of clients. The opinions included are not intended to be taken as fact but are Hobbs Wealth Management’s interpretation of the impact of external events on investments.
The information herein was obtained from various sources. Hobbs Wealth Management does not guarantee the accuracy or completeness of information provided by third parties. The information in this report is given as of the date indicated and is believed to be reliable. Hobbs Wealth Management assumes no obligation to update this information, or to advise on further developments relating to it.
This article contains external links directing you to a third-party website. Although we have reviewed the website prior to creating the link, we are not responsible for the content of the site.
An index is an unmanaged portfolio of specific securities, the performance of which is often used as a benchmark in judging the relative performance of certain asset classes. Investors cannot invest directly in an index. An index does not charge management fees or brokerage expenses, and no such fees or expenses were deducted from the performance shown.
The mention of specific securities and sectors illustrates the application of our investment approach only and is not to be considered a recommendation. The specific securities identified and described herein do not represent all of the securities purchased or sold for the portfolio, and it should not be assumed that investment in these securities was or will be profitable. There is no assurance that the securities purchased remain in the portfolio, or that securities sold have not been repurchased. For a complete list of holdings, please contact your portfolio advisor.
Hobbs Wealth Management may discuss and display charts, graphs, formulas, stock and sector picks which are not intended to be used by themselves to determine which securities to buy or sell, or when to buy or sell them. This specific information is limited and should not be used on their own to make investment decisions. This information is offered as educational only.