
7/2026 Midyear Commentary
Welcome to the July edition of my Market Newsletter. I keep finding there’s an abundance of noise and confusion in the financial markets, and most Americans don’t know how to cut through the noise and get the data they are really looking for to make informed decisions. Because of this, I’ve created this newsletter, where each month I put together a summary of thinking’s to help educate long-term decisions. With that said, let’s get to it!
Disclaimer: Because of the increased regulation and compliance in the financial industry, I want to start with saying everything in this newsletter is based on my opinion, is not predictive in any way. Also, I used AI to assist in rewriting my newsletter to reduce grammatical errors and to improve syntax.
————————————————————-
I do hope you all had a wonderful and safe 250th Anniversary of the United States of America!
I'm happy to report we are halfway into another year of pursuing financial goals. As always, our approach - and your portfolio - remains anchored in those goals, not in trying to predict the economy or markets. That's our commitment, now and into the future.
Let me quickly restate the principles that guide us:
We're long-term, goal-focused investors, building diversified portfolios.
We don't forecast the economy or time the markets; history shows no reliable patterns. Instead, we seek to capture the portfolio's full potential by weathering the historical temporary dips.
As long as your goals stay constant, so does our plan…and your portfolio, aside from routine rebalancing.
We trust in the power of long-term compounding, following Charlie Munger's wisdom: never interrupt compounding without good reason.
Looking at the current landscape:
The U.S. stock market has been on an incredible win streak. To see how far we've come, look at the total returns (which include reinvested dividends) for the S&P 500 over the last few years, sourced Yahoo Finance:
2023: +26.3%
2024: +25.0%
2025: +17.9%
The market has kept that momentum moving into this year. Even after briefly dropping nearly 10% when conflict broke out in the Middle East, the market shook it off almost instantly and rallied to sit up about 8% by midyear.
When things look “this good”, it’s easy to forget where this growth came from. This historic run grew directly out of the painful 2022 market, where stocks dropped 25.4%.
That year, inflation hit 9%, global supply chains were broken, and the Federal Reserve raised interest rates faster than at any point in its history. Bonds had their worst year since 1937, and the news was filled with words like "bloodbath." Yet, history shows us that these tough, panicky downturns are exactly what clear out excesses and set the stage for the next big leg up.
AI Tech Wave
To see how emotions drive the market today, look at what happened over just two months between April and June.
On April 2, a new fund (an ETF) launched that focused entirely on semiconductor and AI chip stocks. Investors scrambled to get in, pouring a record-breaking $10 billion into the fund in just 43 days.
On Friday, June 5, the mood flipped. The tech-heavy Nasdaq dropped nearly 5% in a single day. Overseas markets in Taiwan and South Korea, which are packed with chip companies, dropped 7% and 14%. Wall Street's "fear index" (the VIX) spiked 40% in 24 hours.
Takeaway: This fast-forward cycle of excitement and panic shows exactly what we are dealing with. On one hand, corporate profits are genuinely soaring because of real breakthroughs in technology, which is incredible! On the other hand, because everyone has crowded into a few massive tech stocks, investors are swinging between intense "FOMO" (Fear Of Missing Out) and the sudden panic that the whole thing is a bubble about to burst.
What Happens Over Decades? Big Picture
When the daily news gets overwhelming – happens to me anytime I get sucked down the news rabbit hole - the best antidote is to zoom out and look at how the stock market behaves over long periods. The pattern has never changed, literally has never changed over history: a few years of rising prices, followed by a sharp but temporary drop, followed by a recovery to brand-new highs. Yep… that simple
Look at the S&P 500's track record since the middle of the last century:
In 1950: The index started the year at just 17.
Today: It sits around 7,400.
Over those decades, there have been 17 different times when the market dropped by 20% or more. That is an average of one major drop every 4.5 years, with the average decline stripping away about 30% of the market's value.
Yet, even with those 17 major downturns, the market grew at an average rate of 11.6% per year over that entire span. A single $10,000 investment in 1950, left entirely alone to grow, would be worth $44.7 million today, source.
The lesson is clear: the long-term gains heavily outweigh the short-term drops. Because no one can consistently time when a drop will start or end, the only historically reliable way to capture those millions in growth is to stay in your seat and ride out the bumps.
Are We Repeating history? (Looking at 1999–2000)
For disciplined investors, today's market looks very similar to the famous "Dot-Com" tech boom of the late 1990s:
High Prices: Based on company earnings, stock prices are significantly higher than their 30-year average. The only times they've been this expensive were right before the 2020 pandemic and during the massive tech bubble of 1999.
Concentration: Just a few giant tech companies now make up roughly 40% of the entire S&P 500. This means the index behaves less like a diversified basket of safe companies and more like a single trend.
While profits look great on paper, a closer look shows that a massive chunk of last quarter's earnings didn't come from selling products. Instead, giant companies like Nvidia, Amazon, and Google simply marked up the estimated "value" of the smaller AI start-ups they own.
Different: Even with these similarities to the dot.com recession – there are very real differences. One of the largest differences is that the companies in the dot.com recession weren’t reporting ANY earnings at all! The companies driving earnings today have solid businesses. So, what am I getting at? Even with these similarities, there are stark differences in today’s market versus the dot.com recession of 1999-2000.
The Danger of Trying to Time the Market
When stocks look expensive, it is incredibly tempting to jump out of the market to cash and wait for a drop. But history shows that trying to protect your money this way usually backfires.
Back on December 5, 1996, the head of the Federal Reserve, Alan Greenspan, famously warned that the market was suffering from "irrational exuberance" (meaning it was dangerously overpriced). He seemed right, but the market didn't care. It kept climbing for another three years, more than doubling to peak in the year 2000.Anyone who panicked and went to cash based on his warning missed out on years of massive growth.
Looking Forward
We cannot defend any market price, doesn’t matter if it’s high or low, and yes, just like all markets a sharp drop can occur at a moments notice. But instead of panicking, we lean on the strategy we built for you and the already mentioned Principles listed above:
1. Accept the Bumps: Sharp drops are part of the broader market; this has historically beat inflation and funds your retirement.
2. Don't Run to Cash: You cannot historically safely protect your money by hiding in cash. The market can turn on a dime and race to new highs overnight. If you are sitting on the sidelines when that happens, your long-term retirement plan may never recover from missing out.
3. Trust the Process: Rather than reacting to daily headlines, we use a process called rebalancing. When one sector (like tech) gets unsustainably huge, we systematically sell a little of it to buy safer, underpriced investments. If you’re a client of Hobbs Wealth Management, you likely get several emails a month indicating trades on your account… just an example of the regular rebalancing.
If you’re a client of Hobbs Wealth Management and you don’t feel confident in your plan, please reach out immediately so we can discuss. If you’re not a client of ours and want to learn more, let’s get an introductory meeting scheduled.
Additional Data: Each month I get asked by clients what additional resources I’m looking at. Please hear me in stating I’m not trying to predict anything whatsoever, just some of the interesting data I’m watching.
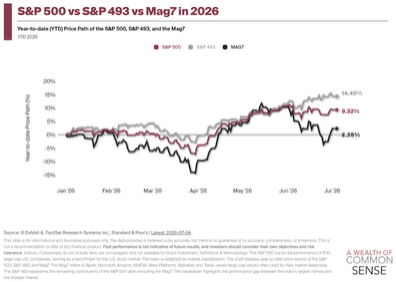
S&P 493 outpacing the Mag 7: Most don’t realize that the Mag 7 stock companies are only up 2.35% YTD while the other 493 in the S&P 500 are up 14.4% - source
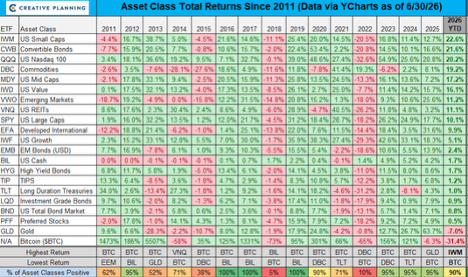
Who did best the first 6 months? In this chart you’ll see the best performer, US Small caps, and the worst performers, Bitcoin and Gold.
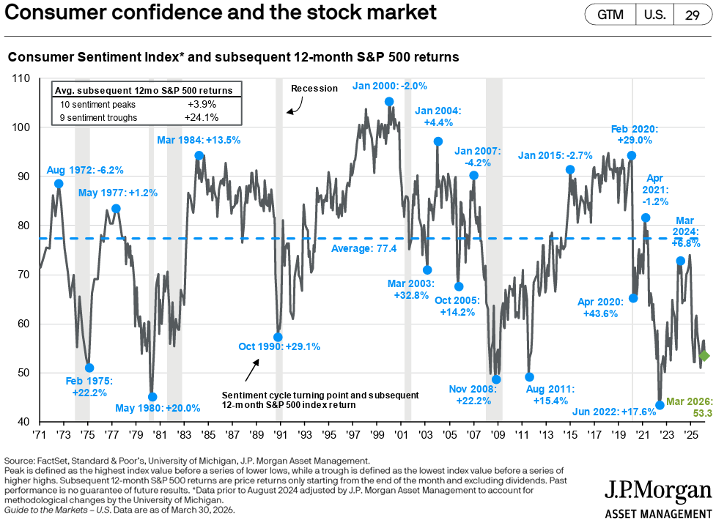
Take a minute to study this chart, you’ll see 55 years of volatile consumer confidence, then consider… what has the S&P 500 actually “done” over the last 55 years? If you put in 1k in the S&P 500 back in 1971, that same 1k would be valued at 352k today! Source: www.ofdollarsanddata.com
Breakeven Inflation Rate - 5-Year Breakeven inflation rate is now 2.31%. You better believe this is going to garner significant attention by the Federal Reserve and the incoming Fed President. I’m curious to see what happens in the next few months.
Debt Interest Payments – Most in this country would agree that the Federal Debt is just too high, but did you realize that the interest payments on this debt is now just over 1.2 trillion a year? What should we do about it? My guess is we should balance the government budget…. But no one is asking me.
In closing:We of course cannot control what the market does from here and we cannot predict when the next market downturn will occur. But we can control our behavior to these outside events and continue to stick with our long-term investment strategy.
As always, thank you for your trust. If you have any questions/concerns, please contact me. If you found this useful, please share with someone you care about.
-Dave
David Hobbs, CFP®
Wealth Advisor | Owner
Hobbs Wealth Management
Past performance may not be indicative of future results. Investing in securities involves risks, including the potential for loss of principal. There is no guarantee that any investment plan or strategy will be successful.
Standard & Poor’s 500 (S&P 500) - a market-cap weighted index composed of the common stocks of 500 leading companies in leading industries of the U.S. economy.
Russell 2000 – The index measures the performance of the small-cap segment of the US equity universe. It is a subset of the Russell 3000 and includes approximately 2000 of the smallest securities based on a combination of their market cap and current index membership.
MSCI ACWI ex USA – The index measures the performance of the large and mid-cap segments of the particular regions, excluding USA equity securities, including developed and emerging markets. It is free float-adjusted market-capitalization weighted.
Federal Funds Rate - refers to the target interest rate set by the Federal Open Market Committee (FOMC). This target is the rate at which commercial banks borrow and lend their excess reserves to each other overnight.
This report was prepared by Hobbs Wealth Management, a State registered investment adviser under the Investment Advisers Act of 1940. Registration as an investment adviser does not imply a certain level of skill or training. The oral and written communications of an adviser provide you with information about which you determine to hire or retain an adviser. Neither the information nor any opinion expressed it so be construed as solicitation to buy or sell a security of personalized investment, tax, or legal advice. For more information please visit: https://adviserinfo.sec.gov/ and search for our firm name.
This newsletter is prepared to provide a degree of insight into the analysis used by Hobbs Wealth Management to make investment decisions. It is not a complete description of all the factors used by Hobbs Wealth Management to make decisions on behalf of clients. The opinions included are not intended to be taken as fact but are Hobbs Wealth Management’s interpretation of the impact of external events on investments.
The information herein was obtained from various sources. Hobbs Wealth Management does not guarantee the accuracy or completeness of information provided by third parties. The information in this report is given as of the date indicated and is believed to be reliable. Hobbs Wealth Management assumes no obligation to update this information, or to advise on further developments relating to it.
This article contains external links directing you to a third-party website. Although we have reviewed the website prior to creating the link, we are not responsible for the content of the site.
An index is an unmanaged portfolio of specific securities, the performance of which is often used as a benchmark in judging the relative performance of certain asset classes. Investors cannot invest directly in an index. An index does not charge management fees or brokerage expenses, and no such fees or expenses were deducted from the performance shown.
The mention of specific securities and sectors illustrates the application of our investment approach only and is not to be considered a recommendation. The specific securities identified and described herein do not represent all of the securities purchased or sold for the portfolio, and it should not be assumed that investment in these securities was or will be profitable. There is no assurance that the securities purchased remain in the portfolio, or that securities sold have not been repurchased. For a complete list of holdings, please contact your portfolio advisor.
Hobbs Wealth Management may discuss and display charts, graphs, formulas, stock and sector picks which are not intended to be used by themselves to determine which securities to buy or sell, or when to buy or sell them. This specific information is limited and should not be used on their own to make investment decisions. This information is offered as educational only.