1/2026 How Strong is the Market as We Head into the New Year?
Welcome to the January edition of my Market Newsletter. I keep finding there’s an abundance of noise and confusion in the financial markets, and most Americans don’t know how to cut through the noise and get the data they are really looking for to make informed decisions. Because of this, I’ve created this newsletter, where each month I put together a summary of thinking’s to help educate long-term decisions. With that said, let’s get to it!
Disclaimer: Because of the increased regulation and compliance in the financial industry, I want to start with saying everything in this newsletter is based on my opinion, is not predictive in any way, and in an effort to make this content as accessible as possible, AI was used to help re-write my content and remove grammatical errors.
Full written article below with sources.
I'm pleased to share that we've wrapped up another strong year in pursuing financial goals. As always, our approach - and your portfolio - remains anchored in those goals, not in trying to predict the economy or markets. That's our commitment, now and into the future.
Let me quickly restate the principles that guide us:
We're long-term, goal-focused investors, building diversified portfolios.
We don't forecast the economy or time the markets, history shows no reliable patterns. Instead, we capture the portfolio's full potential by weathering the historical temporary dips.
As long as your goals stay constant, so does our plan…and your portfolio, aside from routine rebalancing.
We trust in the power of long-term compounding, following Charlie Munger's wisdom: never interrupt compounding without good reason.
Looking at the current landscape:
2025 marked the third year of double-digit equity gains, fueled by a robust economy and rising corporate earnings. Analysts project even stronger growth, around 15% for 2026 and 2027. Profit margins hit 13.1% in Q3, defying expectations amid inflation pressures and AI spending. Employment has softened (unemployment at 4.7%), but that has boosted productivity, allowing wage increases. The Fed has implemented recent rate cuts, loosening by 175 basis points and with upcoming tax refunds potentially giving the GDP a boost, the outlook from the economists feels positive…. but… time will tell.
Yet, much of this good news gets overshadowed by negative headlines, like job market worries. Burning questions: last year's recession fears, then Fed rate cuts, now AI bubbles – they often distract from the big picture. Typically, recessions are caused by the unknown unknowns, not the known unknowns like AI bubbles, Federal Debt levels, job market worries and the like.
The market's tech concentration and high valuations are real, but they're not timing signals for us. We'll address them through rebalancing, staying true to our plan. As one part of the portfolio rises or falls outside of the acceptable ranges, we’ll actively rebalance back into the acceptable range.
The next surprise or market down-turn? Likely from left field, but it won't derail our long-term path, which has been historically reliable for investors like you.
This next section has to do with a review from 1975 – 2025. Below is a chart created to help show how the global economy has shifted over the past 50 years.
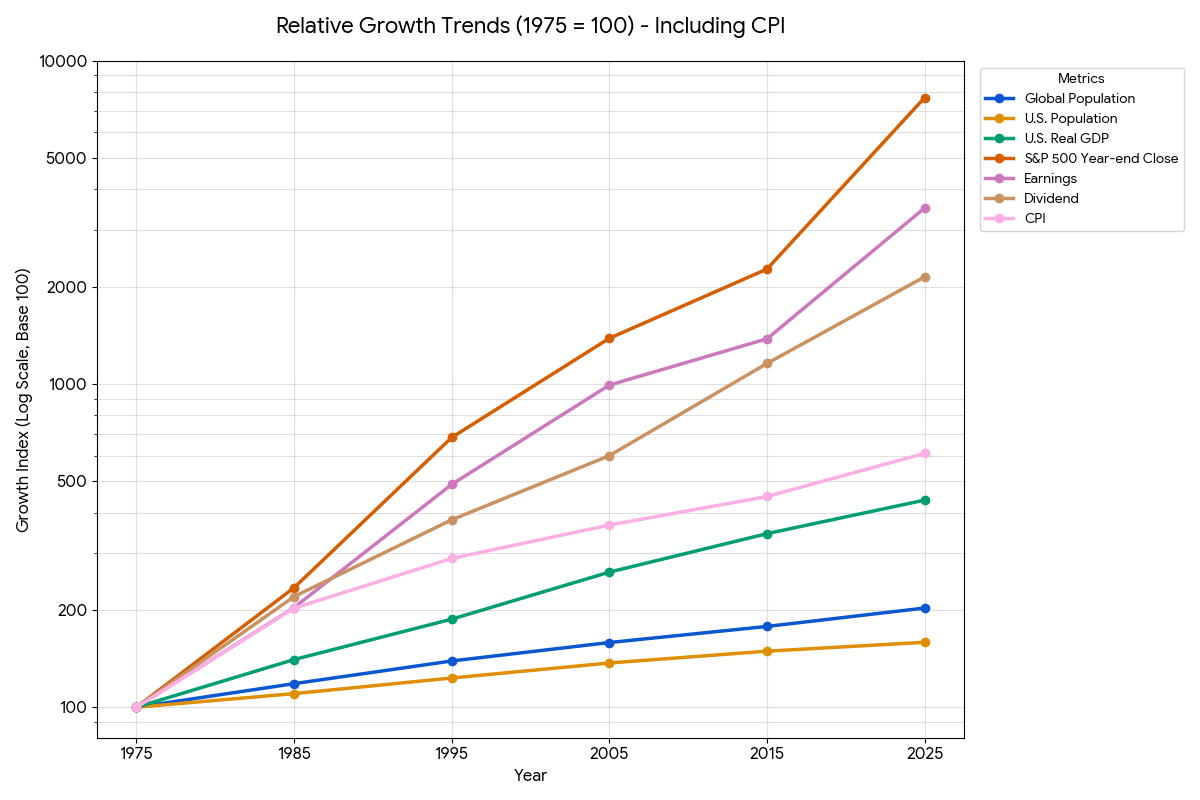
Data sourced from census.gov, data.worldbank.org, finance.yahoo.com; bls.gov>cpi>data
S&P 500 - In 1975, the S&P 500 was around 90; today it’s nearly 7,000. This has likely been the greatest source of wealth creation the world has ever seen. I’d argue we live in the most "democratized" era of investing in history. In 1975, buying stocks required a high-priced broker and expensive commissions. Today, anyone with internet access can own a piece of the 77x growth engine with $1 and zero commissions. Broad market investing has likely never been more available.
GDP - The U.S. economy is producing more value than it did 50 years ago. For Example, the Real GDP Per Capita in 1975 was 25.4k/per person. The same figure in 2025 is 69.9k/per person. When I write this, I feel an odd pull,…why is that? Because all I read in the news media is how everyone talked about how unaffordable things are. My take? Yes, inflation is higher than it was a few years ago, but I don’t think we realize how good we have it.
Earnings & Dividends - Since 1975, corporate earnings have exploded by 35x and Dividends aren’t far behind, while CPI has only increased by 6x. Historically, the more companies earn, the more they pay in Dividends. Some define dividends as a truly passive paycheck.
So what am I getting at with this chart and follow-up information? The market is likely to continue to be volatile, having short-term price swings, but the long-term is incredibly attractive.
We don’t know what 2026 will bring, but I do have faith and confidence in the long-term outlook of investing.
Additional Data: Each month I get asked by clients what additional resources I’m looking at. Please hear me in stating I’m not trying to predict anything whatsoever, just some of the interesting data I’m watching.
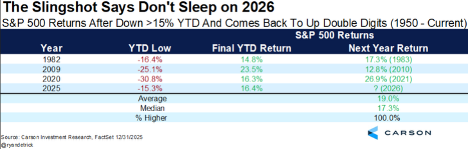
- Only three other times has the S&P 500 been down 15% during the calendar year and then finished up 15%+. In each prior occurrence, the market was positive double digits. Will the trend continue?
Here’s a question I’ve heard for years … “Why should I own anything other than the S&P 500?” – Well… we finally have our answer…
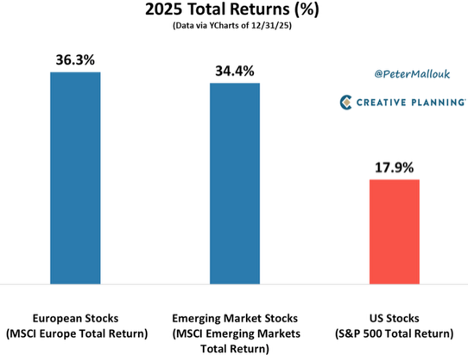
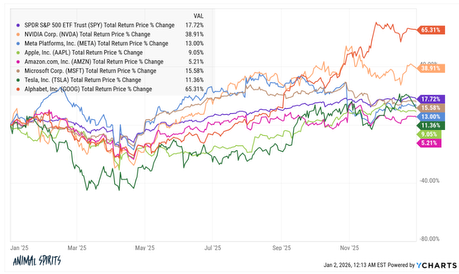
Here’s another common phrase… “I’m just going to own the Mag 7” Well… again, diversification won the day. Not many realize that only two companies, Nvidia and Google beat the S&P 500, and in the prior chart, international beat the S&P 500!
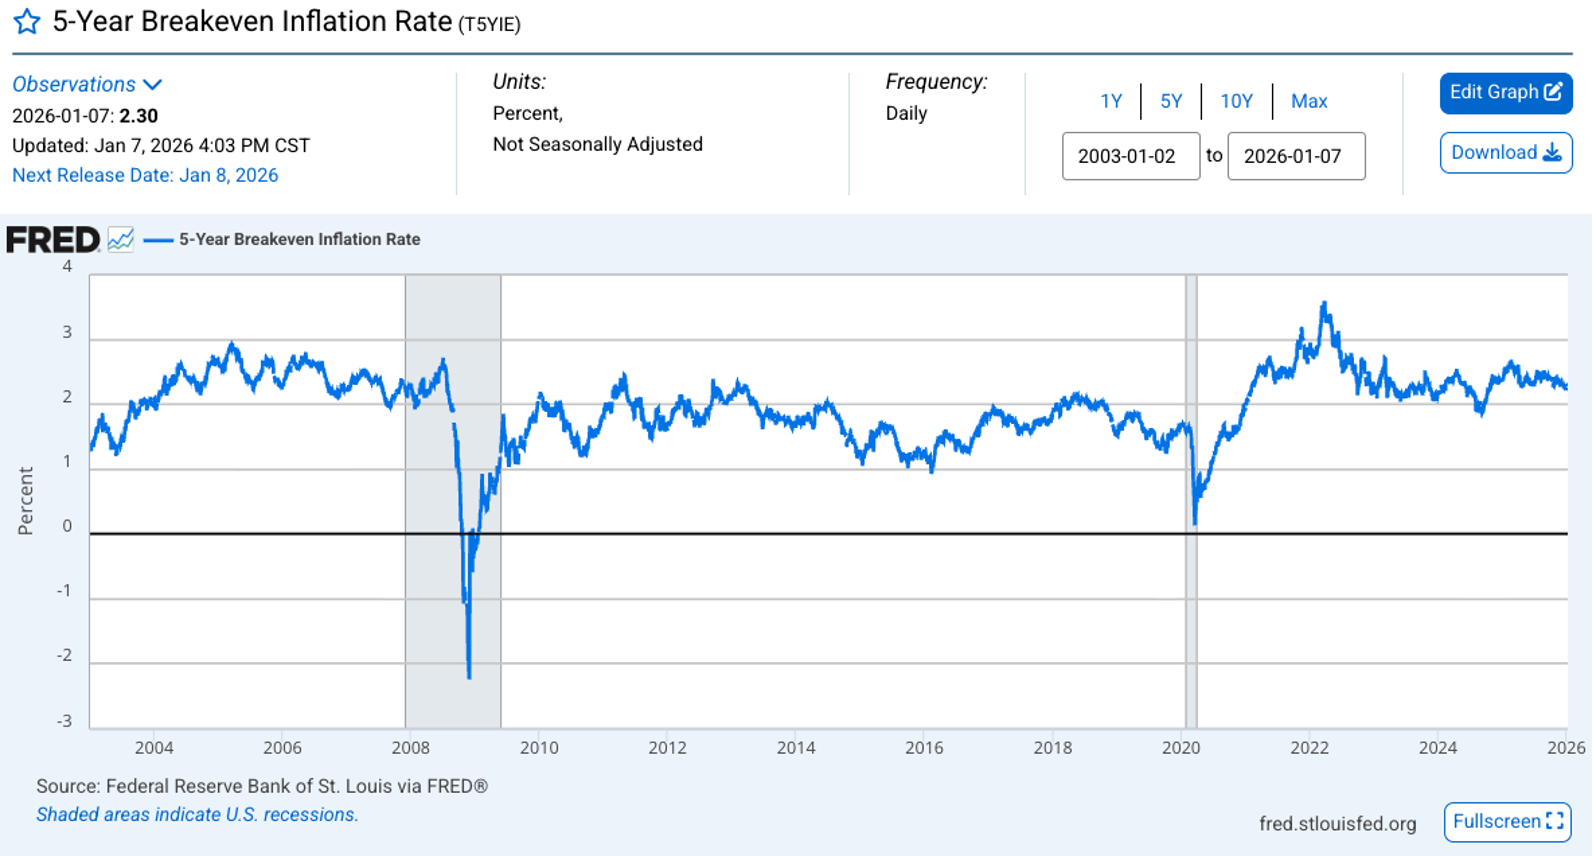
Breakeven Inflation Rate - 5-Year Breakeven inflation rate is now 2.40%. When you study this chart, you’ll see it goes back to 2004. From this past month, the inflation rate has ticked higher.
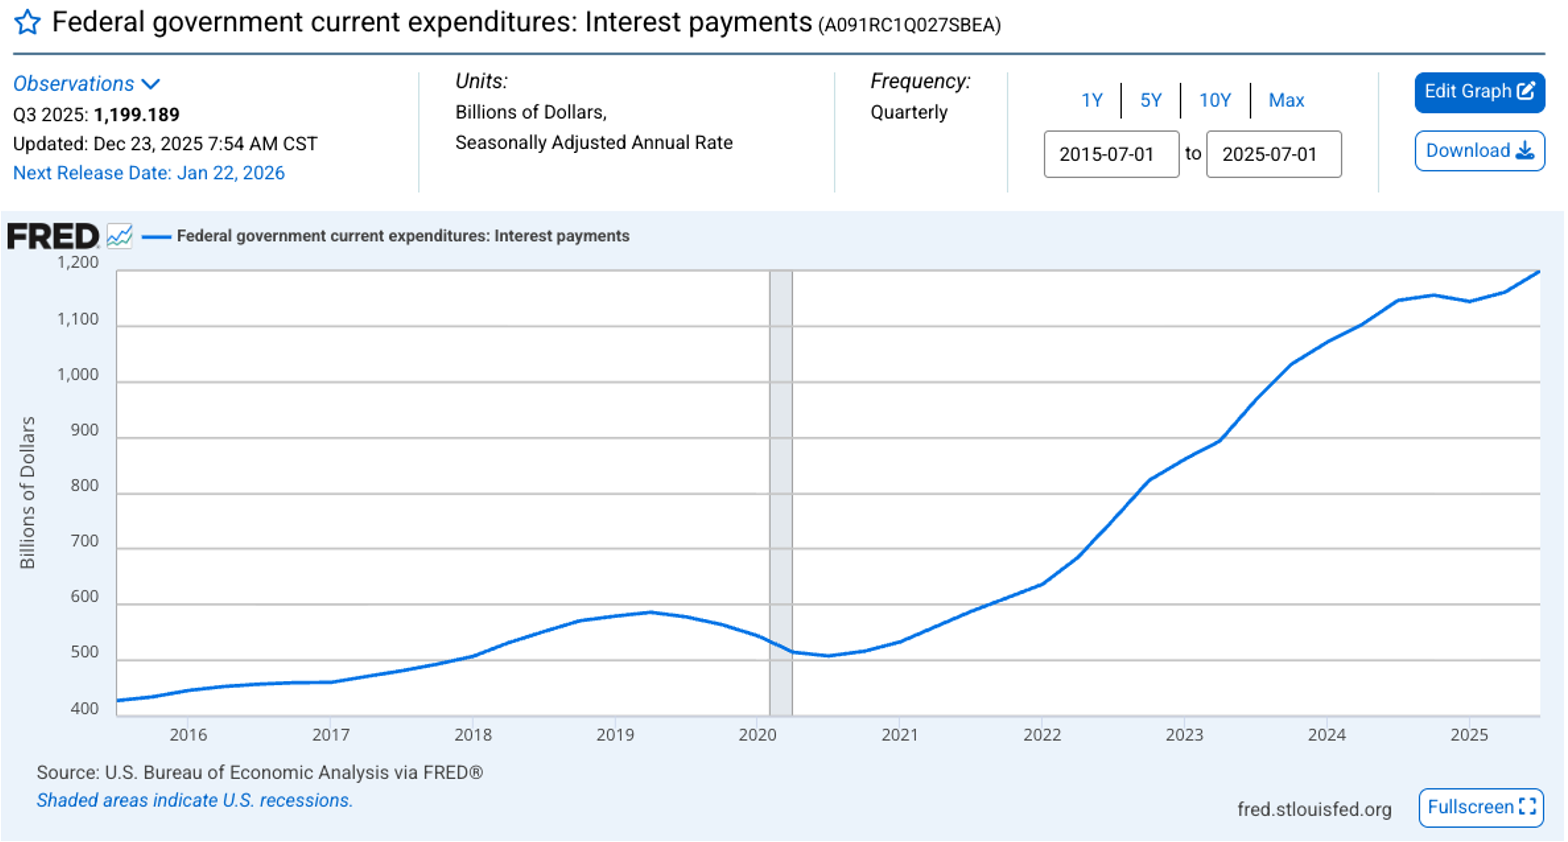
Debt Interest Payments – Most in this country would agree that the Federal Debt is just too high, but did you realize that the interest payments on this debt is just under 1.2 trillion a year? This continues to go the wrong direction. What should we do about it? My guess is we should balance the government budget…. But no one is asking me. What’s more, there’s about 3 Trillion in debt to be reissued in 2025 and the broad assumption is that the new interest rates will be quite a bit higher on the reissued debt. So what will this mean? It’ll likely mean even a greater about of debt interest payments.
In closing: We of course cannot control what the market does from here and we cannot predict when the next market downturn will occur. But we can control our behavior to these outside events and continue to stick with our long-term investment strategy.
As always, thank you for your trust. If you have any questions/concerns, please contact me. If you found this useful, please share with someone your care about.
-Dave
David Hobbs, CFP®
Wealth Advisor | Owner
Hobbs Wealth Management
Past performance may not be indicative of future results. Investing in securities involves risks, including the potential for loss of principal. There is no guarantee that any investment plan or strategy will be successful.
Standard & Poor’s 500 (S&P 500) - a market-cap weighted index composed of the common stocks of 500 leading companies in leading industries of the U.S. economy.
Russell 2000 – The index measures the performance of the small-cap segment of the US equity universe. It is a subset of the Russell 3000 and includes approximately 2000 of the smallest securities based on a combination of their market cap and current index membership.
MSCI ACWI ex USA – The index measures the performance of the large and mid-cap segments of the particular regions, excluding USA equity securities, including developed and emerging markets. It is free float-adjusted market-capitalization weighted.
Federal Funds Rate - refers to the target interest rate set by the Federal Open Market Committee (FOMC). This target is the rate at which commercial banks borrow and lend their excess reserves to each other overnight.
This report was prepared by Hobbs Wealth Management, a State registered investment adviser under the Investment Advisers Act of 1940. Registration as an investment adviser does not imply a certain level of skill or training. The oral and written communications of an adviser provide you with information about which you determine to hire or retain an adviser. Neither the information nor any opinion expressed it so be construed as solicitation to buy or sell a security of personalized investment, tax, or legal advice. For more information please visit: https://adviserinfo.sec.gov/ and search for our firm name.
This newsletter is prepared to provide a degree of insight into the analysis used by Hobbs Wealth Management to make investment decisions. It is not a complete description of all the factors used by Hobbs Wealth Management to make decisions on behalf of clients. The opinions included are not intended to be taken as fact but are Hobbs Wealth Management’s interpretation of the impact of external events on investments.
The information herein was obtained from various sources. Hobbs Wealth Management does not guarantee the accuracy or completeness of information provided by third parties. The information in this report is given as of the date indicated and is believed to be reliable. Hobbs Wealth Management assumes no obligation to update this information, or to advise on further developments relating to it.
This article contains external links directing you to a third-party website. Although we have reviewed the website prior to creating the link, we are not responsible for the content of the site.
An index is an unmanaged portfolio of specific securities, the performance of which is often used as a benchmark in judging the relative performance of certain asset classes. Investors cannot invest directly in an index. An index does not charge management fees or brokerage expenses, and no such fees or expenses were deducted from the performance shown.
The mention of specific securities and sectors illustrates the application of our investment approach only and is not to be considered a recommendation. The specific securities identified and described herein do not represent all of the securities purchased or sold for the portfolio, and it should not be assumed that investment in these securities was or will be profitable. There is no assurance that the securities purchased remain in the portfolio, or that securities sold have not been repurchased. For a complete list of holdings, please contact your portfolio advisor.
Hobbs Wealth Management may discuss and display charts, graphs, formulas, stock and sector picks which are not intended to be used by themselves to determine which securities to buy or sell, or when to buy or sell them. This specific information is limited and should not be used on their own to make investment decisions. This information is offered as educational only.