12/2025 The Rollercoaster of 2025
Welcome to the December edition of my Market Newsletter. I keep finding there’s an abundance of noise and confusion in the financial markets, and most Americans don’t know how to cut through the noise and get the data they are really looking for to make informed decisions. Because of this, I’ve created this newsletter, where each month I put together a summary of thinking’s to help educate long-term decisions. With that said, let’s get to it!
Disclaimer: Because of the increased regulation and compliance in the financial industry, I want to start with saying everything in this newsletter is based on my opinion and is not predictive in any way.
Full written article below with sources.
Holy smokes, 2025 has been a wild ride, hasn't it? As your advisor, I've been right there with you through every twist and turn, and I wanted to take a moment to reflect on what's happened in the markets this year. It's been exciting, a bit nerve-wracking at times, but ultimately rewarding for those who've stayed the course.
The Highs and Lows of 2025
The S&P 500 hit its peak high of 6,920.34 on October 29, 2025, reflecting a surge driven by strong economic data and innovation in key sectors. On the flip side, the index dipped to its lowest point of 4,910.42 on April 8, 2025, I’m sure we can all remember this low from “Liberation Day” and tariffs. From that April low, the market staged an impressive recovery, climbing over 39% to recent levels around 6,816 as of December 2, 2025.
This volatility was intense! Definitely gave me heartburn…45 days where the market moved at least 1%. That’s close to 23% of trading days this year. The annualized volatility for 2025 came in at approximately 19.53%. To put this into context, the historical average is 18% over the past decade. In other words, as crazy as the ups and downs have seemed, 2025 has actually been a fairly average year in terms of market swings when compared to history. It's a reminder that markets are dynamic. Kind of like what Charlie Munger said… “The big money is not in the buying and selling, but in the waiting.”
Strong Returns Stand Out
What hasn't been average this year? The investment returns— they've been outstanding! As of December, 2025, the S&P 500's year-to-date return is about 15-17%. This is well above the long-term average annual return for the S&P 500 over the past 50 years, which has hovered between 8% and 11% (around 10.5% including dividends since 1957). I'm thrilled to see these gains! It’s a testament to your resilience as investors during volatility. Kudos to you!
I might be proven wrong with this statement, but I don’t believe I had a single client who “went to cash” during this volatile year. As the year is ending, it looks like it was the hard and right decision.
The Power of Rebalancing
Navigating a year like this is why I make it a priority to regularly rebalance your portfolios. The vast majority of accounts get rebalanced at least once a month to keep your asset allocation on target, helping us lock in gains from hot sectors while trimming back where things might be getting overheated.
You know those automated trade emails you get from Schwab? That's me hitting the button on your behalf, working on optimizing your portfolio. It's one of the ways I work behind the scenes to help you sleep better at night.
A Note on Year-End Tax Planning
With the end of the year approaching and these strong returns in mind, now's a perfect time to remind you about tax planning. I believe I’ve spoken with every client who is interested in tax-loss harvesting, IRA to Roth, Qualified Charitable Distributions from IRA, and other concepts. If you think we haven’t connected on something important, please reach out to me ASAP. **As a reminder, I’m not a tax advisor so this isn’t tax advice**
Looking Ahead: Optimism in Uncertainty
Of course, we don't know what the future holds…no crystal ball here! But I’m confident in is this: innovation doesn’t stop. The world will keep moving forward, new ideas will become new products, and businesses will continue to turn profits along the way. This ongoing progress is what fuels the broad stock market, and do you know who benefits from this? It is the owners of these companies, people like you and me. By staying diversified and focused on your long-term goals, we're well-positioned to work on handling whatever comes next, together.
If you have any questions about your portfolio, want to dive deeper into tax ideas, or just feel like chatting about the markets, please reach out. I'm always happy to connect. Thank you for your trust; it's a privilege to be on this journey with you. Here's to a strong finish to 2025 and an even brighter 2026! (Source for the above: Yahoo Finance)
Additional Data: Each month I get asked by clients what additional resources I’m looking at. Please hear me in stating I’m not trying to predict anything whatsoever, just some of the interesting data I’m watching.
- Democracy and Capitalism are Mutually Reinforcing – I’ll encourage everyone to take 5-10 minutes to read this heady article. It makes a great point and a wonderful reminder of how democracy and capitalism are interdependent.
- American Exceptionalism – when I study this chart, I am just stunned at the magnitude of the US market. As you can see, 21 of the top 25 stock companies are based in the US… also notable, none are in the EU

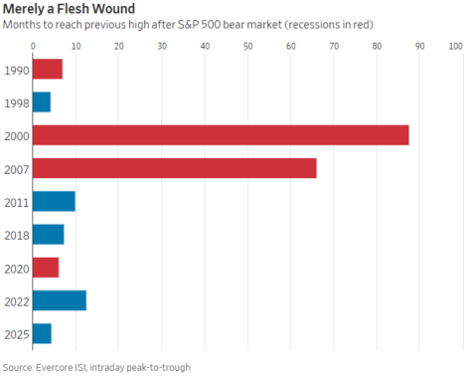
- Do we need a Recession? No – I’m not asking for a recession, but I do want to highlight this article from aWealthOfCommonSense.com – below are two charts, the first is showing the number of years between 40%+ recessions, and the next is the number of months it took to make a new all-time high. What am I getting at? I’m driving home the point that we investors best be on alert. As of late, the stock market has gone down quickly and has recovered almost just as quickly. To me, this creates an environment of thinking… “The market only goes up.” Well, for anymore who invested through the 2007-09 Financial Recession, we know that isn’t the case. (If you’re curious, I started in this industry in March 2008… yeah… not a great year to start).

- 2025 and 2026 Price Targets - In las month’s blog, I compiled the 10-15 year return estimate from some of the largest investment companies in the world, then compared against their estimates from 15 years ago. If you want to see more, just check out last month’s blog for a breakdown. This month, I want to share this chart, it’s comparing the 2025 S&P 500 Target and the 2026 Target. Of course these are all targets and who knows what the future will hold, but good to see all the same.

- Breakeven Inflation Rate - 5-Year Breakeven inflation rate is now 2.29%. When you study this chart, you’ll see it goes back to 2004. From this past month, the inflation rate has ticked higher.
- Debt Interest Payments – Most in this country would agree that the Federal Debt is just too high, but did you realize that the interest payments on this debt is now over 1.1 trillion a year? What should we do about it? My guess is we should balance the government budget…. But no one is asking me. What’s more, there’s about 3 Trillion in debt to be reissued in 2025 and the broad assumption is that the new interest rates will be quite a bit higher on the reissued debt. So what will this mean? It’ll likely mean even a greater about of debt interest payments.
In closing: We of course cannot control what the market does from here and we cannot predict when the next market downturn will occur. But we can control our behavior to these outside events and continue to stick with our long-term investment strategy.
-Dave
David Hobbs, CFP®
Wealth Advisor | Owner
Hobbs Wealth Management
Past performance may not be indicative of future results. Investing in securities involves risks, including the potential for loss of principal. There is no guarantee that any investment plan or strategy will be successful.
Standard & Poor’s 500 (S&P 500) - a market-cap weighted index composed of the common stocks of 500 leading companies in leading industries of the U.S. economy.
Russell 2000 – The index measures the performance of the small-cap segment of the US equity universe. It is a subset of the Russell 3000 and includes approximately 2000 of the smallest securities based on a combination of their market cap and current index membership.
MSCI ACWI ex USA – The index measures the performance of the large and mid-cap segments of the particular regions, excluding USA equity securities, including developed and emerging markets. It is free float-adjusted market-capitalization weighted.
Federal Funds Rate - refers to the target interest rate set by the Federal Open Market Committee (FOMC). This target is the rate at which commercial banks borrow and lend their excess reserves to each other overnight.
This report was prepared by Hobbs Wealth Management, a State registered investment adviser under the Investment Advisers Act of 1940. Registration as an investment adviser does not imply a certain level of skill or training. The oral and written communications of an adviser provide you with information about which you determine to hire or retain an adviser. Neither the information nor any opinion expressed it so be construed as solicitation to buy or sell a security of personalized investment, tax, or legal advice. For more information please visit: https://adviserinfo.sec.gov/ and search for our firm name.
This newsletter is prepared to provide a degree of insight into the analysis used by Hobbs Wealth Management to make investment decisions. It is not a complete description of all the factors used by Hobbs Wealth Management to make decisions on behalf of clients. The opinions included are not intended to be taken as fact but are Hobbs Wealth Management’s interpretation of the impact of external events on investments.
The information herein was obtained from various sources. Hobbs Wealth Management does not guarantee the accuracy or completeness of information provided by third parties. The information in this report is given as of the date indicated and is believed to be reliable. Hobbs Wealth Management assumes no obligation to update this information, or to advise on further developments relating to it.
This article contains external links directing you to a third-party website. Although we have reviewed the website prior to creating the link, we are not responsible for the content of the site.
An index is an unmanaged portfolio of specific securities, the performance of which is often used as a benchmark in judging the relative performance of certain asset classes. Investors cannot invest directly in an index. An index does not charge management fees or brokerage expenses, and no such fees or expenses were deducted from the performance shown.
The mention of specific securities and sectors illustrates the application of our investment approach only and is not to be considered a recommendation. The specific securities identified and described herein do not represent all of the securities purchased or sold for the portfolio, and it should not be assumed that investment in these securities was or will be profitable. There is no assurance that the securities purchased remain in the portfolio, or that securities sold have not been repurchased. For a complete list of holdings, please contact your portfolio advisor.
Hobbs Wealth Management may discuss and display charts, graphs, formulas, stock and sector picks which are not intended to be used by themselves to determine which securities to buy or sell, or when to buy or sell them. This specific information is limited and should not be used on their own to make investment decisions. This information is offered as educational only.