11/2025 Fed, China, Markets
Welcome to the November edition of my Market Newsletter. I keep finding there’s an abundance of noise and confusion in the financial markets, and most Americans don’t know how to cut through the noise and get the data they are really looking for to make informed decisions. Because of this, I’ve created this newsletter, where each month I put together a summary of thinking’s to help educate long-term decisions. With that said, let’s get to it!
Disclaimer: Because of the increased regulation and compliance in the financial industry, I want to start with saying everything in this newsletter is based on my opinion and is not predictive in any way.
Full written article below with sources.
This month's newsletter covers key updates from the Federal Reserve, progress in U.S.-China trade talks, and thoughts on market volatility and long-term market return assumptions. As always, we're here to discuss how these developments impact your portfolio—feel free to reach out.
Market Update: Federal Reserve's Latest Rate Decision
Last week, the Federal Open Market Committee (FOMC) met and decided to lower the federal funds rate by 25 basis points. As a reminder, the federal funds rate is the rate that banks charge each other for overnight lending purposes. This lowering brings the target range to 3.75%–4.00% (federalreserve.gov). This marks the second consecutive cut this year, following a larger 50-basis-point reduction in September, and represents the lowest benchmark rate in three years, although it doesn’t feel this way… (tradingeconomics.com). The decision reflects the Fed's ongoing efforts to support economic growth while monitoring inflation.
Something to keep in mind, the vote wasn't unanimous—two dissenters preferred to hold rates steady, signaling caution about the pace of easing (reuters.com). Fed Chair Jerome Powell emphasized a data-dependent approach moving forward, with some analysts think another cut could come in December. The Fed also announced it will finish its balance sheet reduction (quantitative tightening) on December 1. If this occurs, it will add more liquidity to the markets. Assuming this happens, this commonly leads to lower interest rates. Lower rates generally support borrowing, business investment, and stock market performance by reducing the cost of capital. However, with inflation still above the Fed's 2% target, the Fed is likely to have a measured approach with adjustments rather than aggressive cuts. As for me, I like the slower response, it seems to me the less risky option. We'll continue monitoring these trends and adjusting portfolios as needed to prioritize your long-term objectives.
U.S.-China Trade Talks: A Step Toward Stability
Early thoughts on U.S.-China trade look to be optimistic. President Trump and Chinese President Xi Jinping had a high-level meeting and the two nations announced a "historic" trade agreement aimed at de-escalating tensions.
Tariff Relief: The U.S. will pause certain "reciprocal tariffs" on China for another year and halt plans for a 100% tariff on Chinese exports to third countries. This should help to prevent disruptions to global supply chains, particularly in autos and technology (Yahoo Finance).
Critical Minerals and Exports: China agreed to lift export restrictions on key rare earth elements that are essential for semiconductors and renewable energy.
Agricultural Commitments: China pledged to purchase significant volumes of U.S. soybeans, boosting American farmers (dtnpf.com).
Other Areas: The deal addresses fentanyl precursors, U.S. chip firm investigations, and reciprocal leader visits in 2026 to foster ongoing dialogue. Trade is tough, it’s hard to balance what should be imported at a lower price and what should be produced domestically at typically a higher price.
Overall, I see this agreement as a temporary calm as opposed to a solid game plan. The reality is that the US and China are the two largest economies and both countries need to act in their own best interest. Broadly, the equity markets responded positively. Keep in mind, the “not knowing” of the future is one of the core reasons we continue to have a diversified strategy for investments.
Market Volatility – I think this will continue
The most common question I hear from clients is … "Do I need to be concerned?" or “Am I on track?
We all must embrace the truth that the answers are always unknowable. Unfortunately, even experienced clients and investors can miss this truth.
At present, the world is full of economic unknowns. In this newsletter, I already highlighted interest rates and Trade with China. But something else with China is the reducing population. When you look at prior powers that are on the downward slide, as China might be, this can cause significant geo-political implications. Just think of Germany in 1914, Japan in 1941, and more recently, Russia in 2022 invading Ukraine.
More on Russia: population continues to drop, worsened by reduced worker inflows and its sluggish economy…I’d even call it a completely destroyed and hallowed out economy. Hopefully, this will push Putin toward talks, as opposed to lashing out.
In the US, we have our own set of problems. Heck, right now the government isn’t even open! Federal entitlement programs continue to grow at an unaffordable rate. And broader federal borrowing, if unchecked, is on the path to be unbearable. The US doesn’t have many options to solve this problem. The most favorable option would be to grow the economy to grow ourselves out of the problem. But I don’t have a lot of faith in our politicians. The next option is to reduce entitlement programs, but again, I don’t have faith in our politicians. The last likely option would be to inflate the US dollar; hopefully we don’t go down this road.
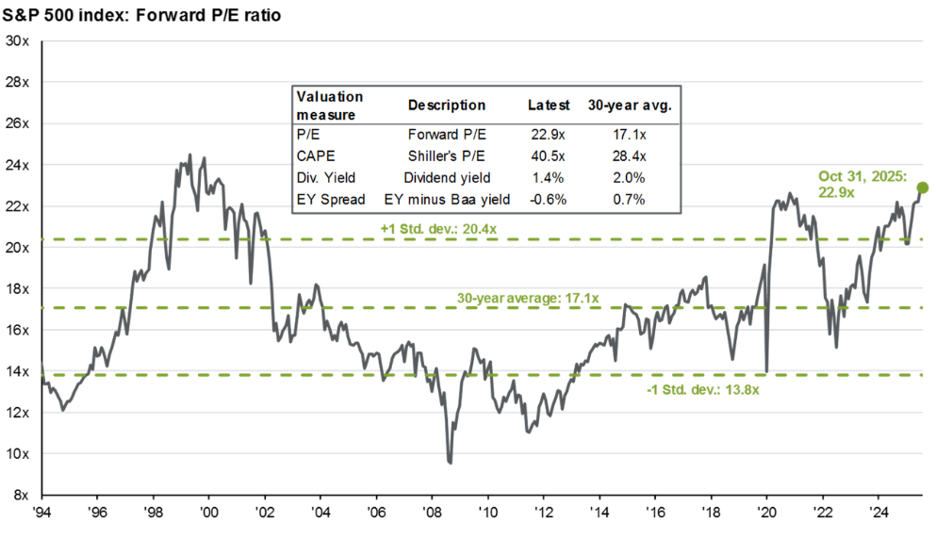
What’s more, the S&P 500 has historically high valuations, at close to 23x forward earnings and the Mag 7 (Apple, Amazon, Alphabet, Meta, Microsoft, Nvidia, and Tesla) make up about 37% of the S&P 500 total market cap. Feel free to pause and review these charts, very busy, lots of good information.
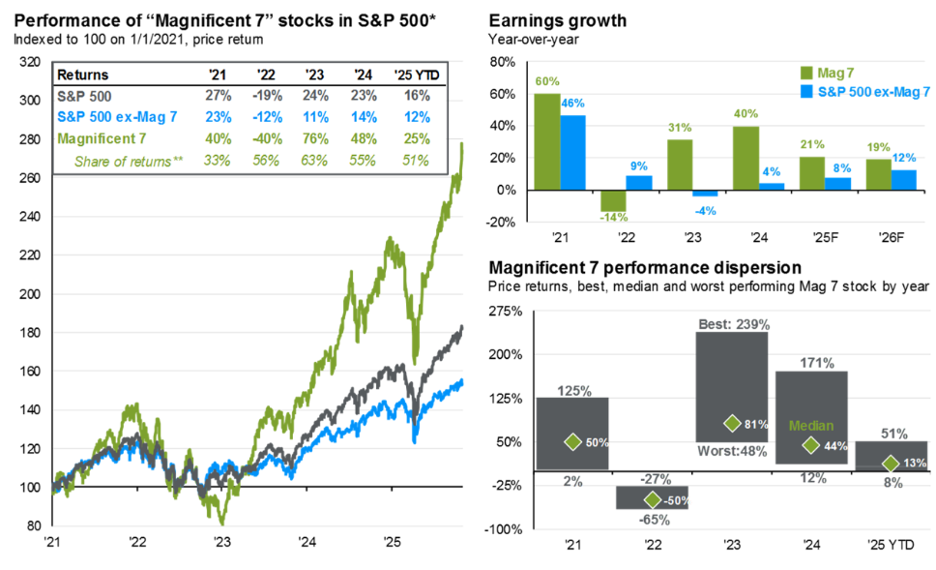
Magnificent 7 performance and earnings dynamics
The chart above (left) shows price return indices for the Magnificent 7, the S&P 500 ex. Magnificent 7 and the S&P 500 itself. The table breaks down the yearly S&P 500 return into contributions from the Mag 7 and the rest of the S&P 500. Over the past few years, the Mag 7 have driven both positive and negative returns at the index level. The chart on the top right shows the yearly earnings growth of the Mag 7 and S&P 500 ex. Mag 7, as well as estimates for 2025 and 2026. The chart on the bottom right shows the performance dispersion between the best and worst performing Mag 7 stock, highlighting that the Mag 7 are not a monolith.
Slide disclosures: Source: Bloomberg, FactSet, Moody’s, Refinitiv Datastream, Robert Shiller, Standard & Poor’s, J.P. Morgan Asset Management.
Forward P/E ratio is the most recent S&P 500 index price divided by consensus analyst estimates for earnings in the next 12 months, provided by IBES since March 1994 and FactSet since January 2022. Shiller’s P/E uses trailing 10-years of inflation-adjusted earnings as reported by companies. Dividend yield is calculated as consensus estimates of dividends in the next 12 months, provided by FactSet, divided by the most recent S&P 500 index price. EY minus Baa yield is the forward earnings yield (the inverse of the forward P/E ratio) minus the Bloomberg U.S. corporate Baa yield since December 2008 and interpolated using the Moody’s Baa seasoned corporate bond yield for values beforehand.
Guide to the Markets – U.S. Data are as of October 31, 2025.
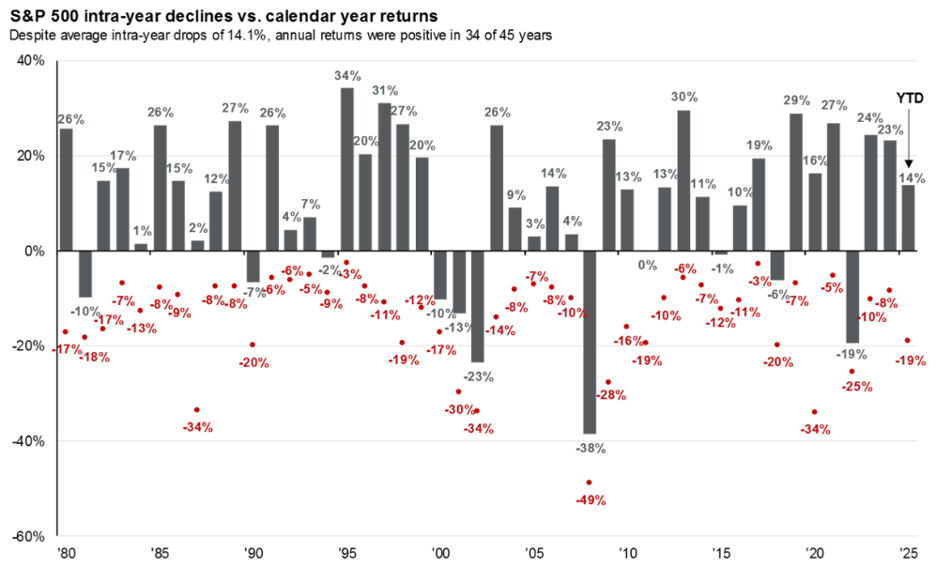
So what am I saying? I’m saying that equity markets have historically been volatile and are likely to continue to be volatile in the future.
This reality is why I normally input this graphic showing the intra-year decline.
Slide Disclosures: Source: FactSet, Standard & Poor’s, J.P. Morgan Asset Management.
Returns are based on price index only and do not include dividends. Intra-year drops refers to the largest peak-to-trough decline during the year. Returns shown are calendar year returns from 1980 to 2024, over which the average annual return was 10.6%. Past performance is no guarantee of future results.
Guide to the Markets – U.S. Data are as of October 31, 2025.
In a world of constant headlines, remember: Your financial plan is designed to withstand volatility, not predict it. The recent Fed cut and U.S.-China trade progress underscore opportunities and challenges. If you have questions or want to review your portfolio, visit hobbswealth.com or contact us directly. We're committed to your success.
Additional Data: Each month I get asked by clients what additional resources I’m looking at. Please hear me in stating I’m not trying to predict anything whatsoever; this is just some of the interesting data I’m watching.
- 2026 Long-Term Capital Market Assumptions – Recently, firms like JP Morgan, Blackrock, Fidelity, Capital Group, SSGA, Franklin Templeton, and others have all come out with their long-term market assumptions. If you’re curious, the companies mentioned, in total, manage close to 30 Trillion dollars. My guess is they have awfully good research teams. If you do a web search for information on their “long-term capital market assumptions” you’ll find a slew of data, almost all of which show a slowing down of future investment returns. Well, it took some doing, but I was able to find one of these reports issued by JP Morgan in 2010 (links to the sources below) and do you know what I find interesting? Back in 2010, JP Morgan, like today, is assuming lower return expectations for the next 10-15 years. Back then they assumed 7.75% annualized returns over the next 10-15 years. Well… the jury is now in and the actual return for the S&P 500 from 11/1/2010 – 10/31/2025 is just over 14%. What am I getting at? I’m trying to re-emphasize the point that no one knows the future…only God does. I don’t care how many trillions these companies may manage.
o JP Morgan 2010 - https://am.jpmorgan.com/content/dam/jpm-am-aem/global/en/insights/portfolio-insights/ltcma/archive/LTCMA-2011.pdf
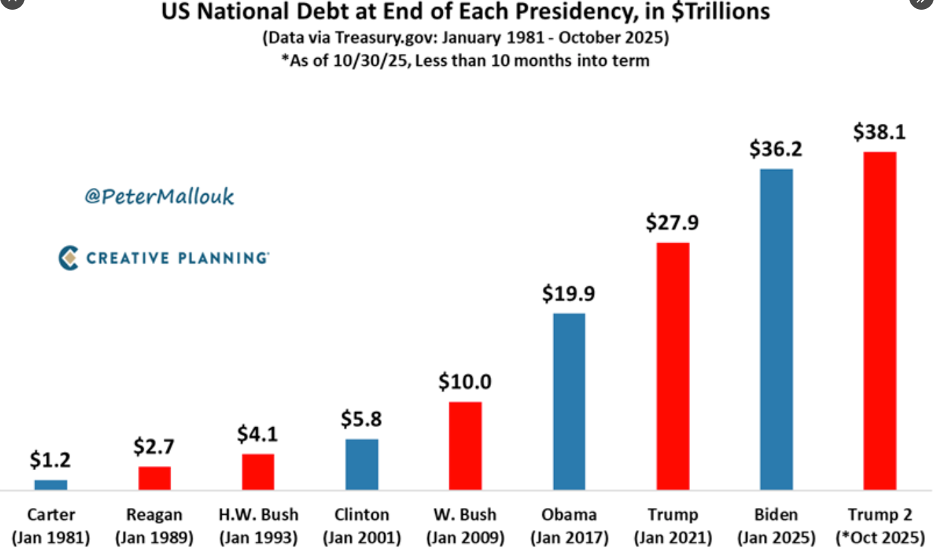
- US Debt by Presidency – “Red or Blue the national debt only goes up… The only thing both parties can agree on is sending the bill to future generations”
- Breakeven Inflation Rate - 5-Year Breakeven inflation rate is now 2.37%. When you study this chart, you’ll see it goes back to 2004. From this past month, the inflation rate has ticked higher.
- Debt Interest Payments – Most in this country would agree that the Federal Debt is just too high, but did you realize that the interest payments on this debt is now over 1.1 trillion a year? What should we do about it? My guess is we should balance the government budget….but no one is asking me. What’s more, there’s about 3 Trillion in debt to be reissued in 2025 and the broad assumption is that the new interest rates will be quite a bit higher on the reissued debt. So what will this mean? It’ll likely mean even a greater amount interest payments on debt.
In closing: We of course cannot control what the market does from here and we cannot predict when the next market downturn will occur. But we can control our behavior in response to these outside events and continue to stick with our long-term investment strategy.
As always, thank you for your trust. If you ave any questions/concerns please contact me. If you found this useful, please share with someone your care about.
-Dave
David Hobbs, CFP®
Wealth Advisor | Owner
Hobbs Wealth Management
Past performance may not be indicative of future results. Investing in securities involves risks, including the potential for loss of principal. There is no guarantee that any investment plan or strategy will be successful.
Standard & Poor’s 500 (S&P 500) - a market-cap weighted index composed of the common stocks of 500 leading companies in leading industries of the U.S. economy.
Russell 2000 – The index measures the performance of the small-cap segment of the US equity universe. It is a subset of the Russell 3000 and includes approximately 2000 of the smallest securities based on a combination of their market cap and current index membership.
MSCI ACWI ex USA – The index measures the performance of the large and mid-cap segments of the particular regions, excluding USA equity securities, including developed and emerging markets. It is free float-adjusted market-capitalization weighted.
Federal Funds Rate - refers to the target interest rate set by the Federal Open Market Committee (FOMC). This target is the rate at which commercial banks borrow and lend their excess reserves to each other overnight.
This report was prepared by Hobbs Wealth Management, a State registered investment adviser under the Investment Advisers Act of 1940. Registration as an investment adviser does not imply a certain level of skill or training. The oral and written communications of an adviser provide you with information about which you determine to hire or retain an adviser. Neither the information nor any opinion expressed it so be construed as solicitation to buy or sell a security of personalized investment, tax, or legal advice. For more information please visit: https://adviserinfo.sec.gov/ and search for our firm name.
This newsletter is prepared to provide a degree of insight into the analysis used by Hobbs Wealth Management to make investment decisions. It is not a complete description of all the factors used by Hobbs Wealth Management to make decisions on behalf of clients. The opinions included are not intended to be taken as fact but are Hobbs Wealth Management’s interpretation of the impact of external events on investments.
The information herein was obtained from various sources. Hobbs Wealth Management does not guarantee the accuracy or completeness of information provided by third parties. The information in this report is given as of the date indicated and is believed to be reliable. Hobbs Wealth Management assumes no obligation to update this information, or to advise on further developments relating to it.
This article contains external links directing you to a third-party website. Although we have reviewed the website prior to creating the link, we are not responsible for the content of the site.
An index is an unmanaged portfolio of specific securities, the performance of which is often used as a benchmark in judging the relative performance of certain asset classes. Investors cannot invest directly in an index. An index does not charge management fees or brokerage expenses, and no such fees or expenses were deducted from the performance shown.
The mention of specific securities and sectors illustrates the application of our investment approach only and is not to be considered a recommendation. The specific securities identified and described herein do not represent all of the securities purchased or sold for the portfolio, and it should not be assumed that investment in these securities was or will be profitable. There is no assurance that the securities purchased remain in the portfolio, or that securities sold have not been repurchased. For a complete list of holdings, please contact your portfolio advisor.
Hobbs Wealth Management may discuss and display charts, graphs, formulas, stock and sector picks which are not intended to be used by themselves to determine which securities to buy or sell, or when to buy or sell them. This specific information is limited and should not be used on their own to make investment decisions. This information is offered as educational only.