10/2025 Secret to Retirement Success
Full written article below with sources.
Disclaimer: Because of the increased regulation and compliance in the financial industry, I want to start with saying everything in this newsletter is based on my opinion and is not predictive in any way.
In my world, there is always an endless number of items/topics I can cover in this monthly newsletter. For example, the government shut down, or the Gaza peace deal, or tariffs, or interest rates, or how the market hasn’t seemed to care about any of it!
This month, I want to do something a little different, I want to share what I see is the secret to a successful retirement.
Since 2008 I’ve been in the financial industry in one form or another so while I haven’t seen everything, I’ve certainly seen a lot.
When it comes to retirement, just about everyone wants to maintain their current standard of living and have it adjust each year to account for inflation, healthcare, and tax rate changes.
That statement seems simple enough but let me share the problem and the secret to a successful retirement.
The problem and the secret is the statement “current standard of living” – do you have any idea what you spend, after taxes, to calculate your current standard of living? Does this number include taxes, healthcare, home maintenance, vacations, gifts, home projects, friend outings, your next Amazon purchase, etc…?
Of course some can answer “Yes” and for the folks who answer yes, I want to applaud you... you are in the minority.
Most have to answer “No” – and more specifically, it’s not just a casual “No” it’s more of a “Heck No!!! I have no idea!!”
Let me share a quick story from an anonymous woman. She has plenty of money, but only spends her monthly Social Security check of about 2k/mo. She spends her time gardening, laughing with friends, going on walks, and enjoying the sunrise and the sunset. When I talk with her about how she can afford to spend money, her response has basically been the same for the past few years… “Dave – do I need more money to have laughs with my friends or does money make the sunset more beautiful?”
My point with this story is that this woman is one of the happiest people I know – and for her, money isn’t happiness.
Now – I realize this woman may be more of an outlier than the norm, but for her, her “current standard of living” is awfully basic and her life is full of happiness.
But… Let me share another story from a former client. This client told me for years their current standard of living was 6k/mo. For years we developed and built the financial plan and showed that the plan can work and provide for a two-person, 35-year retirement based on 6k/mo. When the client was close to 65, this client retired, as we planned. But then do you know what happened? Life happened to this client… the 6k/mo after-tax distribution we planned on for years was no longer enough and the current spending requirement was now over 10k/mo.
Long story short, their plan wasn’t built for 10k/mo, they didn’t have enough assets, and early in retirement their assets started to be spent down faster than could be sustained. It’s a tragic story. Why did this happen? This client lied to themselves about their “current standard of living.” They just assumed 6k/mo was their “current standard of living.”
It’s not right or wrong to live on 2k/mo or 50k/mo – it is right to know what is your “current standard of living.”
So while the “secret” to a successful retirement isn’t flashy, knowing your “current standard of living” is the most critical component for a successful retirement.
If you want to talk more, just reach out. I’m always happy to discuss your position.
History Lesson: What’s the “average” intra-year market decline? I’m happy you asked, the average decline in any given year since 1980 is 14.1%. Year to date in 2025, we’ve experienced aa 19% decline.
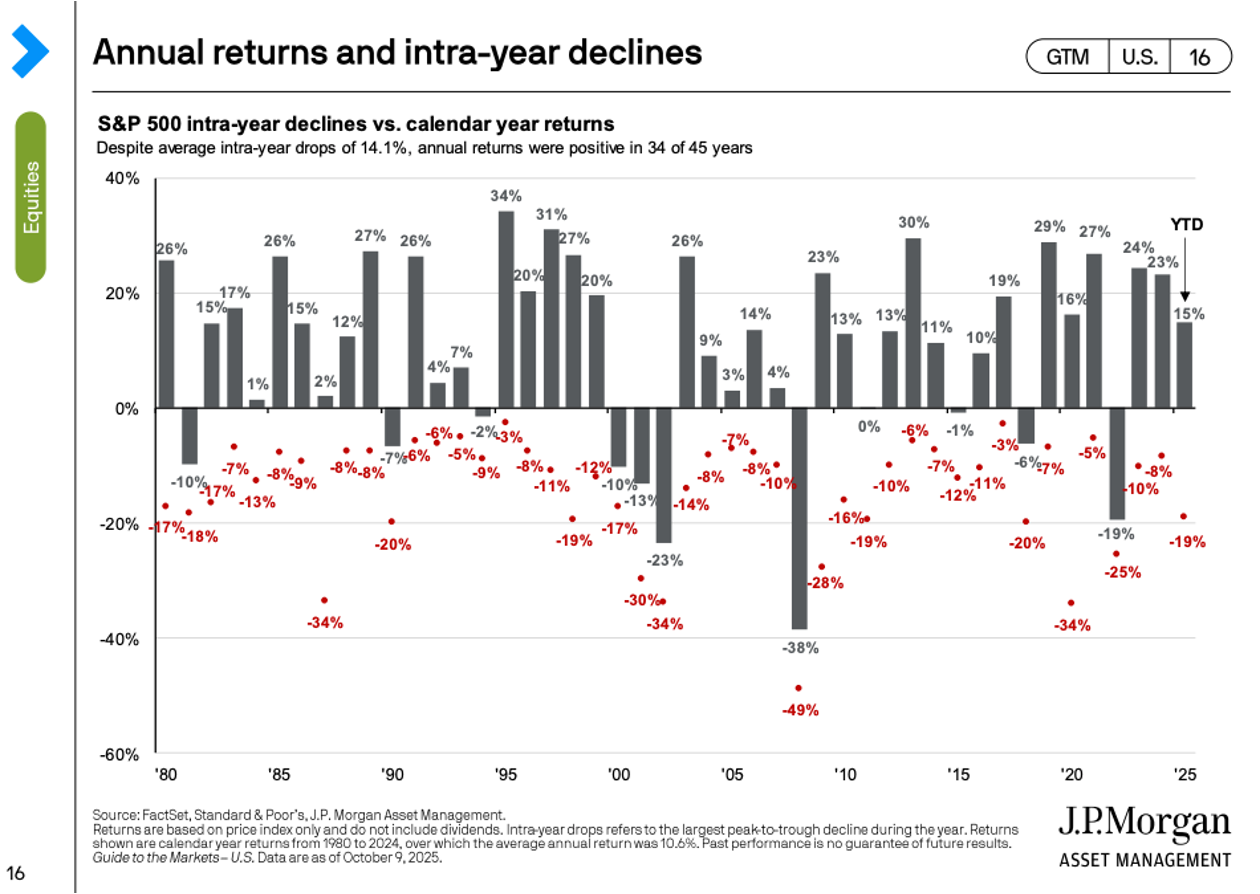
Source: FactSet, Standard & Poor’s, J.P. Morgan Asset Management.
Returns are based on price index only and do not include dividends. Intra-year drops refers to the largest market drops from a peak to a trough during the year. For illustrative purposes only. Returns shown are calendar year returns from 1980 to 2024, over which the average annual return was 10.6%.
Guide to the Markets – U.S. Data are as of Oct 9, 2025. https://am.jpmorgan.com/us/en/asset-management/adv/insights/market-insights/guide-to-the-markets/
Additional Data: Each month I get asked by clients what additional resources I’m looking at. Please hear me in stating I’m not trying to predict anything whatsoever, just some of the interesting data I’m watching.
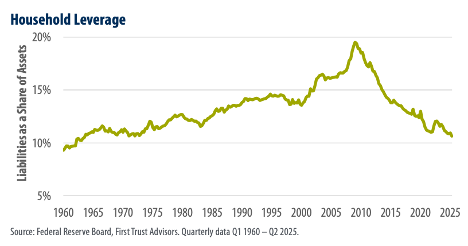
- Household Net Worth – Truly – this has never been better. There are three very interesting charts from this report. My favorite is the “Household Leverage” chart, shown below. But do not miss the chart showing US Net Worth compared to Liabilities.
- Monster Beverage vs. Nvidia – Over the past 25 years, which has been the better performer? I think everyone will be surprised with the answer… Monster. Just another proof point that nobody knows the future…

- Breakeven Inflation Rate - 5-Year Breakeven inflation rate is now 2.35%. When you study this chart, you’ll see it goes back to 2004. From this past month, the inflation rate has ticked higher.
- Debt Interest Payments – Most in this country would agree that the Federal Debt is just too high, but did you realize that the interest payment on this debt has doubled in the past 4 years? What should we do about it? My guess is we should balance the government budget…. But no one is asking me. What’s more, there’s about 3 Trillion in debt to be reissued in 2025 and the broad assumption is that the new interest rates will be quite a bit higher on the reissued debt. So what will this mean? It’ll likely mean even a greater amount of debt interest payments.

In closing: We of course cannot control what the market does from here and we cannot predict when the next market downturn will occur. But we can control our behavior to these outside events and continue to stick with our long-term investment strategy.
As always, thank you for your trust. If you have any questions or concerns please contact me. If you found this useful, please share with someone you care about.
-Dave
David Hobbs, CFP®
Wealth Advisor | Owner
Hobbs Wealth Management
Past performance may not be indicative of future results. Investing in securities involves risks, including the potential for loss of principal. There is no guarantee that any investment plan or strategy will be successful.
Standard & Poor’s 500 (S&P 500) - a market-cap weighted index composed of the common stocks of 500 leading companies in leading industries of the U.S. economy.
Russell 2000 – The index measures the performance of the small-cap segment of the US equity universe. It is a subset of the Russell 3000 and includes approximately 2000 of the smallest securities based on a combination of their market cap and current index membership.
MSCI ACWI ex USA – The index measures the performance of the large and mid-cap segments of the particular regions, excluding USA equity securities, including developed and emerging markets. It is free float-adjusted market-capitalization weighted.
Federal Funds Rate - refers to the target interest rate set by the Federal Open Market Committee (FOMC). This target is the rate at which commercial banks borrow and lend their excess reserves to each other overnight.
This report was prepared by Hobbs Wealth Management, a State registered investment adviser under the Investment Advisers Act of 1940. Registration as an investment adviser does not imply a certain level of skill or training. The oral and written communications of an adviser provide you with information about which you determine to hire or retain an adviser. Neither the information nor any opinion expressed it so be construed as solicitation to buy or sell a security of personalized investment, tax, or legal advice. For more information please visit: https://adviserinfo.sec.gov/ and search for our firm name.
This newsletter is prepared to provide a degree of insight into the analysis used by Hobbs Wealth Management to make investment decisions. It is not a complete description of all the factors used by Hobbs Wealth Management to make decisions on behalf of clients. The opinions included are not intended to be taken as fact but are Hobbs Wealth Management’s interpretation of the impact of external events on investments.
The information herein was obtained from various sources. Hobbs Wealth Management does not guarantee the accuracy or completeness of information provided by third parties. The information in this report is given as of the date indicated and is believed to be reliable. Hobbs Wealth Management assumes no obligation to update this information, or to advise on further developments relating to it.
This article contains external links directing you to a third-party website. Although we have reviewed the website prior to creating the link, we are not responsible for the content of the site.
An index is an unmanaged portfolio of specific securities, the performance of which is often used as a benchmark in judging the relative performance of certain asset classes. Investors cannot invest directly in an index. An index does not charge management fees or brokerage expenses, and no such fees or expenses were deducted from the performance shown.
The mention of specific securities and sectors illustrates the application of our investment approach only and is not to be considered a recommendation. The specific securities identified and described herein do not represent all of the securities purchased or sold for the portfolio, and it should not be assumed that investment in these securities was or will be profitable. There is no assurance that the securities purchased remain in the portfolio, or that securities sold have not been repurchased. For a complete list of holdings, please contact your portfolio advisor.
Hobbs Wealth Management may discuss and display charts, graphs, formulas, stock and sector picks which are not intended to be used by themselves to determine which securities to buy or sell, or when to buy or sell them. This specific information is limited and should not be used on their own to make investment decisions. This information is offered as educational only.