05/2025 THIS Is why we Need a Plan
Full written article below with sources.
Disclaimer: Because of the increased regulation and compliance in the financial industry, I want to start with saying everything in this newsletter is based on my opinion and is not predictive in any way.
April reminded us that markets are unpredictable. From sharp swings in the S&P 500 to global economic uncertainties, volatility has been front and center. Moments like these, underscore the critical importance of having a well-crafted investment and financial plan. Think of it as your financial north star — a steady guide that helps you stay focused on your long-term goals. This is why you need a plan.
When markets start to throw us around, it’s important to remember not to react impulsively. Instead, it’s important to return to the plan, assessing whether adjustments are needed or if staying the course is the best path forward. This disciplined process is why we emphasize diversification and strategic asset allocation, as highlighted a prior blog, “Why We Don’t Just Own the S&P 500”
From February 19, 2025 to April 7, 2025, the S&P 500 dropped from 6,147 to 4,835 – a staggering decline of 21.3%. To me, this fits the definition of volatility!
As of 3:24pm on May 1st, the S&P 500 was at 5,634.
Question for you – The S&P 500 has declined how far since the start of the year?
Answer: The S&P 500 is down 5.31% From Jan 1 to May 1
It’s true, the market has been tossing us around, and that’s an understatement! When the market moves widely, and typically unexpectantly, these are the exact times that we need a plan.
Now, I want to turn our attention from a few months to a few years. Over the past 5 years, which includes the Covid recovery, the 2022 market decline of about 25% and our current decline from all-time highs – The S&P 500 has provided annualized returns of close to 15.5%.
Data sourced from Yahoo Finance.

I want you all to just take a moment and zoom-out. Yes, I realize I’m talking about the S&P 500, but you aren’t just investing in the S&P 500, at the end of the day, we’re investing in companies.
The companies we invest in, I’d argue are some of the best companies in the world, are tasked with innovating and meeting the challenges in a complex world.
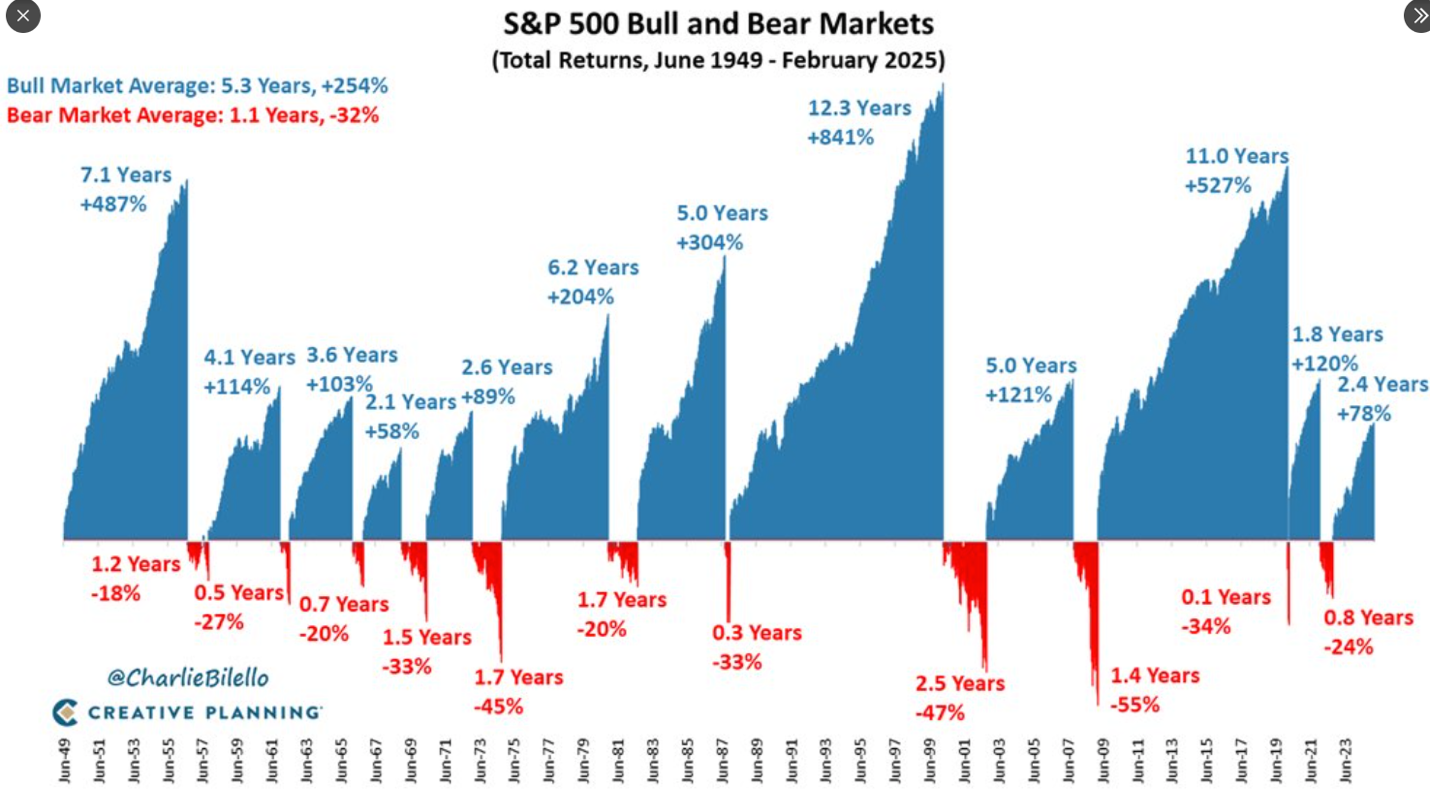
Don’t take my word for it, take a minute and study this next chart. When I study the chart, the word resilience comes to mind.

Yes – I’ll agree with you that we don’t know how all the tariff noise will end up. Yes – this time with tariffs is different, but so was every other event listed on this chart. They were all different and new events, but the broader story is that the companies we invest in have navigated and figured how to innovate and make money in a changing environment.
It sounds odd to admit it, but it is fully true, we plan on the market going down. We plan on the market going up. Using history as a guide, we plan on the market going up a lot more than it goes down.
This next chart shows this reality
History Lesson: What’s the “average” intra-year market decline? I’m happy you asked, the average decline in any given year since 1980 is 14.1%. Year to date in 2025, we’ve experienced an over 20% decline. I’m hoping that’s it for the year!

Source: FactSet, Standard & Poor’s, J.P. Morgan Asset Management.
Returns are based on price index only and do not include dividends. Intra-year drops refers to the largest market drops from a peak to a trough during the year. For illustrative purposes only. Returns shown are calendar year returns from 1980 to 2024, over which the average annual return was 10.6%.
https://am.jpmorgan.com/us/en/asset-management/adv/insights/market-insights/guide-to-the-markets/
Additional Data: Each month I get asked by clients what additional resources I’m looking at. Please hear me in stating I’m not trying to predict anything whatsoever, just some of the interesting data I’m watching.
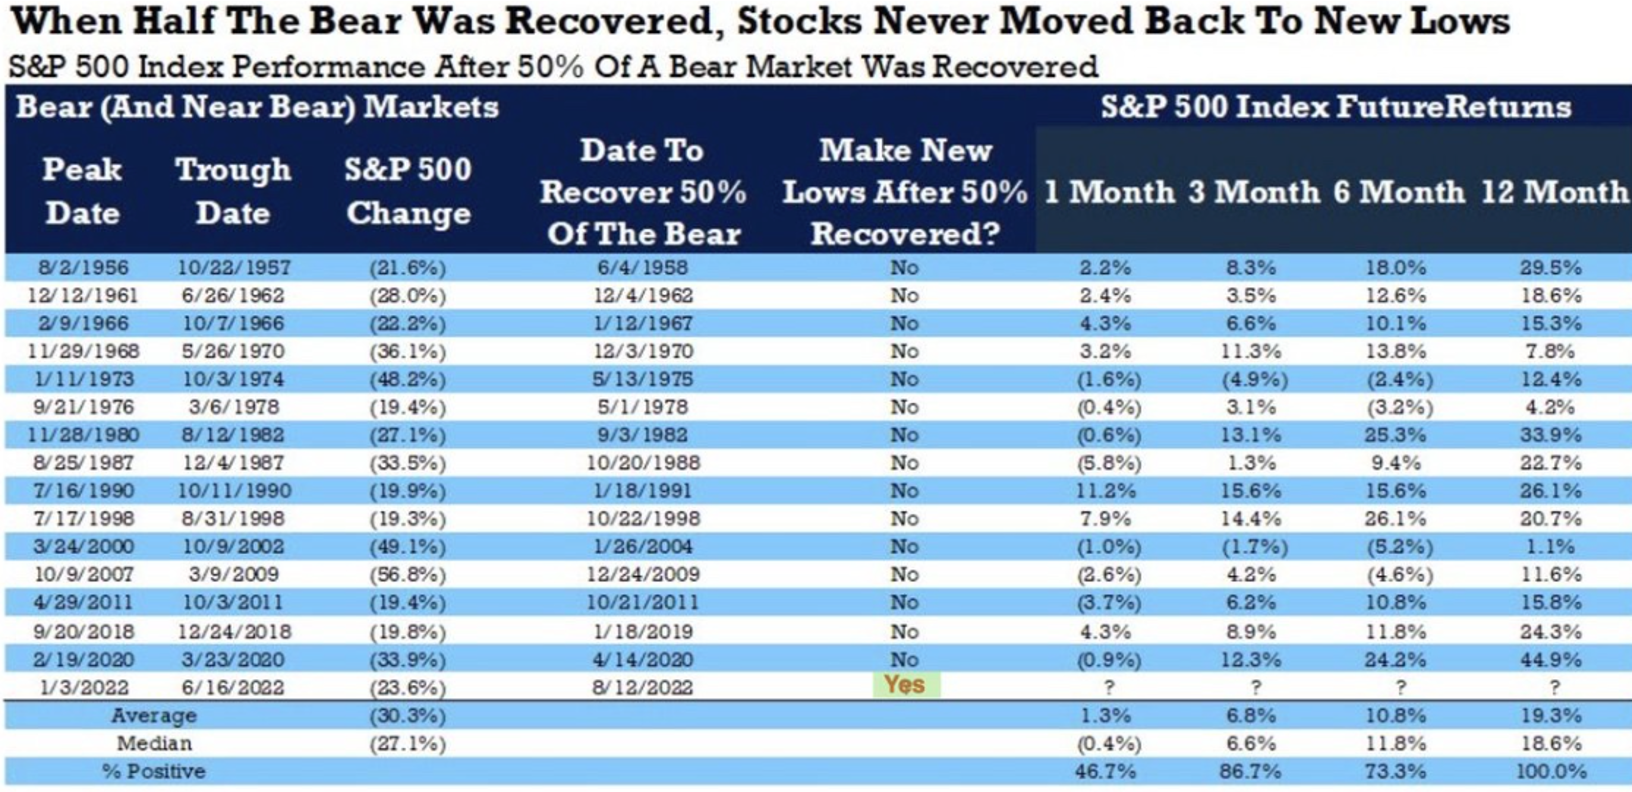
- Is the worst over? This chart shows that when the S&P 500 recovers at least 50% from a bear market (which has already occurred in April 2025), the S&P 500 index is typically higher 12 months later. The point? The worst of this down market may be behind us. Sourced: Ryan Detrick / Carson Group
- Can the dollar remain the Reserve Currency? This is a common question I receive. The idea is that will Bitcoin or will the BRICS countries unseat the dollar as the reserve currency of the world. Well, in my opinion, I don’t think so. But don’t take my word for it. Let me quote this article as I believe this statement is powerful. “There is a common belief that China’s yuan could potentially replace the U.S. dollar as a new reserve currency, or that the BRICS nations (Brazil, Russia, India, China, South Africa) might create a common currency for trade that could challenge the dollar’s dominance. However, you cannot replace a stronger currency with a weaker one. It just doesn’t work. Looking at the countries who are seeing the largest outflows of high net-worth individuals in 2024, China led the list, with a projected net outflow of 15,200 people, followed by the UK, then India. Interestingly, among the top ten countries experiencing the largest outflows of wealthy individuals, half are the BRICS nations. In contrast, the United States has seen the second largest projected increase (+3,800) in high net-worth individuals. Can a country that can’t keep its most productive citizens gain the confidence of other nations to adopt its currency? We think not. The current economic and geopolitical realities suggest that the U.S. dollar’s dominance remains robust… The U.S. is not the strong because the dollar is the reserve currency, the dollar is the reserve currency because the U.S. is strong.”

- Breakeven Inflation Rate - 5-Year Breakeven inflation rate is now 2.31%. When you study this chart, you’ll see it goes back to 2004.
- Federal Reserve Balance sheet – The Fed continues to follow through on it’s statement of reducing the balance sheet. We’re now down to $6.8T dollars in the balance sheet, last time we saw this was May 2020 levels and declining. Historically, the Fed’s balance sheet has been a good measure of Money Supply in this country which is typically tied to inflation.
- Debt Interest Payments – Most in this country would agree that the Federal Debt is just too high, but did you realize that the interest payments on this debt is now over 1.1 trillion a year? What should we do about it? My guess is we should balance the government budget…. But no one is asking me. What’s more, there’s about 3 Trillion in debt to be reissued in 2025 and the broad assumption is that the new interest rates will be quite a bit higher on the reissued debt. So what will this mean? It’ll likely mean even a greater about of debt interest payments.
In closing: We of course cannot control what the market does from here and we cannot predict when the next market downturn will occur. But we can control our behavior to these outside events and continue to stick with our long-term investment strategy.
As always, if you have any questions/concerns please contact me.
David Hobbs, CFP®
Wealth Advisor | Owner
Hobbs Wealth Management
Past performance may not be indicative of future results. Investing in securities involves risks, including the potential for loss of principal. There is no guarantee that any investment plan or strategy will be successful.
**Case Study Disclosure** The case study presented is purely hypothetical and does not represent actual client results. This study is provided for educational purposes only. Similar, or even positive results, cannot be guaranteed. Each client has their own unique set of circumstances so products and strategies may not by suitable for all people. Please consult with a qualified professional before implementing any strategy discussed herein. No portion of this case study is to be interpreted as a testimonial or endorsement of the firms' investment advisory services.
Standard & Poor’s 500 (S&P 500) - a market-cap weighted index composed of the common stocks of 500 leading companies in leading industries of the U.S. economy.
Russell 2000 – The index measures the performance of the small-cap segment of the US equity universe. It is a subset of the Russell 3000 and includes approximately 2000 of the smallest securities based on a combination of their market cap and current index membership.
MSCI ACWI ex USA – The index measures the performance of the large and mid-cap segments of the particular regions, excluding USA equity securities, including developed and emerging market. It is free float-adjusted market-capitalization weighted.
Federal Funds Rate - refers to the target interest rate set by the Federal Open Market Committee (FOMC). This target is the rate at which commercial banks borrow and lend their excess reserves to each other overnight.
This report was prepared by Hobbs Wealth Management a State registered investment adviser under the Investment Advisers Act of 1940. Registration as an investment adviser does not imply a certain level of skill or training. The oral and written communications of an adviser provide you with information about which you determine to hire or retain an adviser. Neither the information nor any opinion expressed it so be construed as solicitation to buy or sell a security of personalized investment, tax, or legal advice. For more information please visit: https://adviserinfo.sec.gov/ and search for our firm name.
This newsletter is prepared to provide a degree of insight into the analysis used by Hobbs Wealth Management to make investment decisions. It is not a complete description of all factors used by Hobbs Wealth Management to make decisions on behalf of clients. The opinions included are not intended to be taken as fact, but are Hobbs Wealth Management’s interpretation of the impact of external events on investments.
The information herein was obtained from various sources. Hobbs Wealth Management does not guarantee the accuracy or completeness of information provided by third parties. The information in this report is given as of the date indicated and believed to be reliable. Hobbs Wealth Management assumes no obligation to update this information, or to advise on further developments relating to it.
This article contains external links directing you to a third-party website. Although we have reviewed the website prior to creating the link, we are not responsible for the content of the sites.
An index is an unmanaged portfolio of specific securities, the performance of which is often used as a benchmark in judging the relative performance of certain asset classes. Investors cannot invest directly in an index. An index does not charge management fees or brokerage expenses, and no such fees or expenses were deducted from the performance shown.
The mention of specific securities and sectors illustrates the application of our investment approach only and is not to be considered a recommendation. The specific securities identified and described herein do not represent all of the securities purchased or sold for the portfolio, and it should not be assumed that investment in these securities were or will be profitable. There is no assurance that the securities purchased remain in the portfolio or that securities sold have not been repurchased. For a complete list of holdings please contact your portfolio advisor.
Hobbs Wealth Management may discuss and display, charts, graphs, formulas, stock and sector picks which are not intended to be used by themselves to determine which securities to buy or sell, or when to buy or sell them. This specific information is limited and should not be used on their own to make investment decisions. This information is offered as educational only.