04/2025 Trump and Tariffs
Full written article below with sources.
Disclaimer: Because of the increased regulation and compliance in the financial industry, I want to start with saying everything in this newsletter is based on my opinion and is not predictive in any way.
************
If you ever wondered about my commitment to you, clients of Hobbs Wealth Management, who have placed their trust in my firm. Know that I’m on Spring Break this week with my family in Florida. I’m not working for you because I feel guilt or fear. I’m working for you because I’ve made a commitment to you and you’ve placed your trust in my firm. For example, looking for and investing extra cash as the market down. I’m not writing this to look for “pats on the back” or “thank you” I’m writing this because unless I tell and show my deep level of commitment for my clients, how will you know? We don’t fully know something by words, we know by deeds.
*************
Serious Question – please contact me if you answer “Yes”
Since Feb 19, 2025, the S&P 500 has dropped from 6,147 to 5,135 (as of 4/4/25 at 10am) – that’s about a 16% decline since the start of 2025, are you concerned enough that you believe it’s time to sell or change investment allocation?
Again, if you answer “Yes” please reach out to me directly.
This can be scary.
This can be confusing.
Personally, for me, Dave Hobbs, I’m not a fan of most tariffs. I do see certain situations where tariffs make sense, but this is a very narrow space.
Yes – this time is different. Just like Covid was different, the Financial Crisis was different, the Dot Com recession and WTC attacks were different, etc…
But let’s not forget the words from John Templeton “the four most dangerous words in investing are ‘this time is different.’”
If you answered “Yes” and you do contact me, and please do! Know I’m going to ask you a series of questions and pull up your long-term retirement/financial plan. Why? Because as I wrote in my November 2024 blog post, we plan on markets going two directions. We plan on it going up and we plan on it going down. Part of the trouble is that we don’t get to predict when the ups will happen and when the downs will happen.
What’s more, I’ll also remind you of the investment growth rate assumptions we use. We don’t use the historical 30-50 year return data which is close to 10-11% per year, we use a figure closer to 7.5-8% per year. Why? Because we don’t know that the next 30-50 years will be like the last 30-50 years.
Just weeks ago, “experts” predicted a surge, but now the narrative has shifted to fears of a decline. The current tariff schedule is set to disrupt global supply chains and raising costs for U.S. manufacturers like Apple, Nike, Ford, and General Motors and many others, source. Of course, the goal of tariffs is to discourage outsourcing and make American-made goods more competitive, but in the short term, and potentially longer term, they’ve triggered higher costs, reduced profits, and loads of uncertainty.
Uncertainty is likely one of the biggest threats to the companies we invest. How can a company that makes or manufactures anything make plans with rapidly changing inputs? Who knows what the long-term impact will be. If I were to guess? My guess is Trump will walk back most of these tariffs, but who knows, no one is asking me.
What’s more, affected nations are preparing and implementing retaliatory tariffs on American goods. The tariff calculations, at present (4/3/25), seem overly simplistic—based on trade deficits divided by export values—leading to shockingly high rates, such as the 64% tariff on Indonesian imports, source.
When markets decline, like they did yesterday at 5% and today at 4%, it’s common to want to sell everything to protect principal. However, let’s not forget our history. For example, during the COVID-19 crash, some investors sold at the bottom only to miss out on the rapid recovery that followed.
The truth is, no one can predict how far markets will fall or when they’ll recover. What we do know is that markets have historically rebounded over time, every single time. Periodic corrections—like the recent drop in the S&P 500—are part of the ups and downs of investing.
My assumption? The trade war will eventually end; markets will stabilize; innovation will continue driving growth.
Emotions are human, but don’t let emotions dictate your financial decisions. History favors those who stay invested through uncertainty rather than those who try to time the market.
History Lesson: What’s the “average” intra-year market decline? I’m happy you asked, the average decline in any given year since 1980 is 14.1%. Year to date in 2025, we’re down about 16%. That doesn’t mean we won’t go lower, that just means we’re average right now.

Source: FactSet, Standard & Poor’s, J.P. Morgan Asset Management.
Returns are based on price index only and do not include dividends. Intra-year drops refers to the largest market drops from a peak to a trough during the year. For illustrative purposes only. Returns shown are calendar year returns from 1980 to 2024, over which the average annual return was 10.6%.
https://am.jpmorgan.com/us/en/asset-management/adv/insights/market-insights/guide-to-the-markets/
Additional Data: Each month I get asked by clients what additional resources I’m looking at. Please hear me in stating I’m not trying to predict anything whatsoever, just some of the interesting data I’m watching.
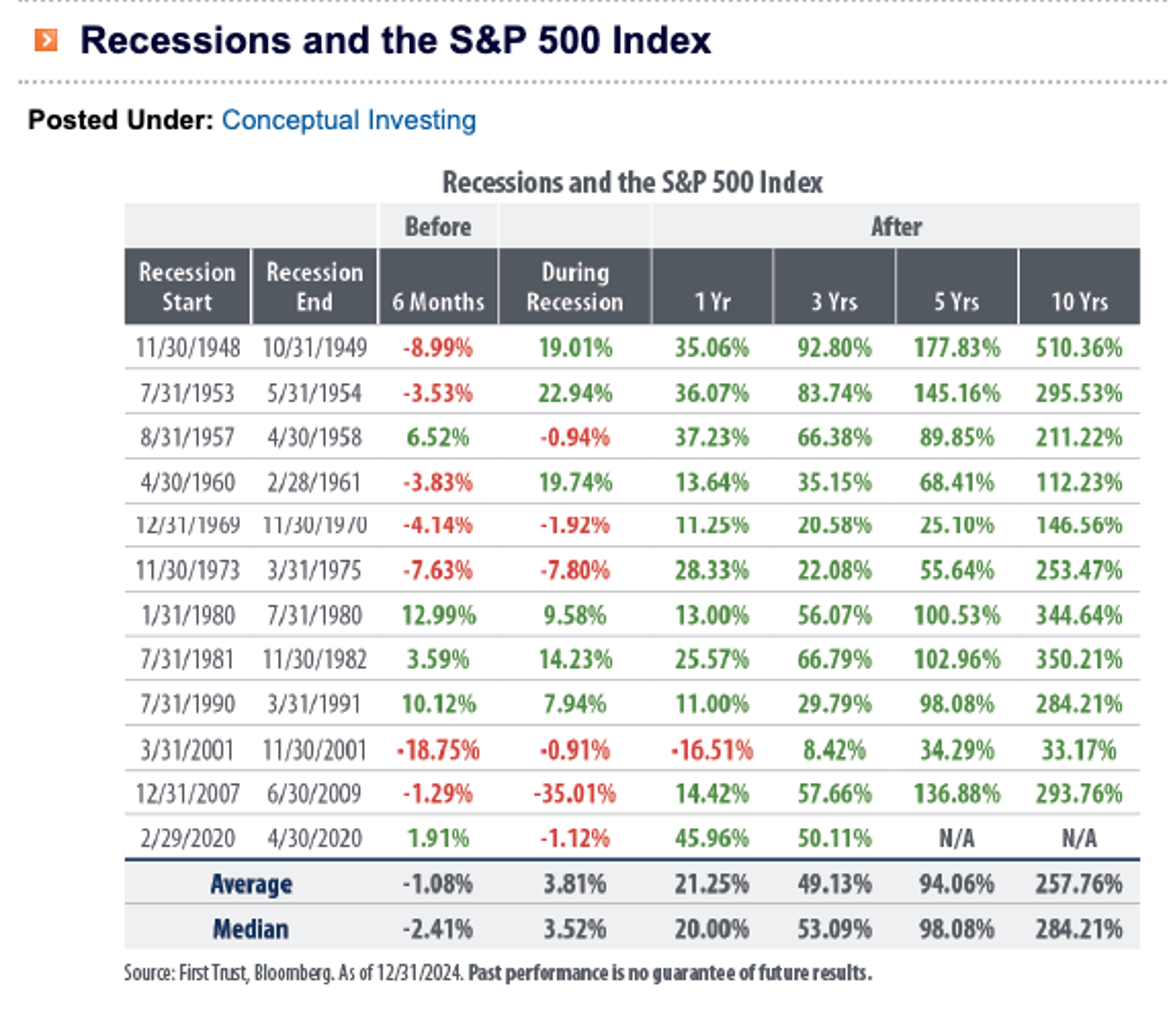
- Recession History Lesson – I’m going to encourage everyone to review this short yet effective post from First Trust. The article outline how common recessions are then that the average S&P 500 return after one year is +21%, then after three and five years the S&P 500 return is positive +49% and +94% respectively.
- Is a Stock or Bond Portfolio Better? – I always find this chart to be interesting. If you look closely, you can see that depending on the length of time, the historical portfolio allocation winner becomes clear.

Click on the link for full disclosures - https://am.jpmorgan.com/us/en/asset-management/institutional/insights/market-insights/guide-to-the-markets/
- Trillions in Money Markets – At it’s highest level ever reported, there’s now 6.8T in money market funds. In the investing market, this is called “Dry Powder.” These are dollars enjoying higher levels of interest than in years past. But ask yourself, what do you think will happen when/if the Federal reserve starts to cut interest rates and banks start paying less in interest on these accounts? Do you really think people will just continue to hold their funds with less interest, or do you think they’ll look for other alternatives to make money? My guess is assuming interest rates come down, these people will start to move some of these funds back into the broader market. So what do you think would likely happen to market prices if this does occur?
- Breakeven Inflation Rate - 5-Year Breakeven inflation rate is now 2.59%. When you study this chart, you’ll see it goes back to 2004.
- Federal Reserve Balance sheet – The Fed continues to follow through on it’s statement of reducing the balance sheet. We’re now down to $6.8T dollars in the balance sheet, last time we saw this was May 2020 levels and declining. Historically, the Fed’s balance sheet has been a good measure of Money Supply in this country which is typically tied to inflation.
- Debt Interest Payments – Most in this country would agree that the Federal Debt is just too high, but did you realize that the interest payments on this debt is now over 1.1 trillion a year? What should we do about it? My guess is we should balance the government budget…. But no one is asking me. What’s more, there’s about 3 Trillion in debt to be reissued in 2025 and the broad assumption is that the new interest rates will be quite a bit higher on the reissued debt. So what will this mean? It’ll likely mean even a greater about of debt interest payments.
In closing: We of course cannot control what the market does from here and we cannot predict when the next market downturn will occur. But we can control our behavior to these outside events and continue to stick with our long-term investment strategy.
As always, if you have any questions/concerns please contact me.
David Hobbs, CFP®
Wealth Advisor | Owner
Hobbs Wealth Management
Past performance may not be indicative of future results. Investing in securities involves risks, including the potential for loss of principal. There is no guarantee that any investment plan or strategy will be successful.
**Case Study Disclosure** The case study presented is purely hypothetical and does not represent actual client results. This study is provided for educational purposes only. Similar, or even positive results, cannot be guaranteed. Each client has their own unique set of circumstances so products and strategies may not by suitable for all people. Please consult with a qualified professional before implementing any strategy discussed herein. No portion of this case study is to be interpreted as a testimonial or endorsement of the firms' investment advisory services.
Standard & Poor’s 500 (S&P 500) - a market-cap weighted index composed of the common stocks of 500 leading companies in leading industries of the U.S. economy.
Russell 2000 – The index measures the performance of the small-cap segment of the US equity universe. It is a subset of the Russell 3000 and includes approximately 2000 of the smallest securities based on a combination of their market cap and current index membership.
MSCI ACWI ex USA – The index measures the performance of the large and mid-cap segments of the particular regions, excluding USA equity securities, including developed and emerging market. It is free float-adjusted market-capitalization weighted.
Federal Funds Rate - refers to the target interest rate set by the Federal Open Market Committee (FOMC). This target is the rate at which commercial banks borrow and lend their excess reserves to each other overnight.
This report was prepared by Hobbs Wealth Management a State registered investment adviser under the Investment Advisers Act of 1940. Registration as an investment adviser does not imply a certain level of skill or training. The oral and written communications of an adviser provide you with information about which you determine to hire or retain an adviser. Neither the information nor any opinion expressed it so be construed as solicitation to buy or sell a security of personalized investment, tax, or legal advice. For more information please visit: https://adviserinfo.sec.gov/ and search for our firm name.
This newsletter is prepared to provide a degree of insight into the analysis used by Hobbs Wealth Management to make investment decisions. It is not a complete description of all factors used by Hobbs Wealth Management to make decisions on behalf of clients. The opinions included are not intended to be taken as fact, but are Hobbs Wealth Management’s interpretation of the impact of external events on investments.
The information herein was obtained from various sources. Hobbs Wealth Management does not guarantee the accuracy or completeness of information provided by third parties. The information in this report is given as of the date indicated and believed to be reliable. Hobbs Wealth Management assumes no obligation to update this information, or to advise on further developments relating to it.
This article contains external links directing you to a third-party website. Although we have reviewed the website prior to creating the link, we are not responsible for the content of the sites.
An index is an unmanaged portfolio of specific securities, the performance of which is often used as a benchmark in judging the relative performance of certain asset classes. Investors cannot invest directly in an index. An index does not charge management fees or brokerage expenses, and no such fees or expenses were deducted from the performance shown.
The mention of specific securities and sectors illustrates the application of our investment approach only and is not to be considered a recommendation. The specific securities identified and described herein do not represent all of the securities purchased or sold for the portfolio, and it should not be assumed that investment in these securities were or will be profitable. There is no assurance that the securities purchased remain in the portfolio or that securities sold have not been repurchased. For a complete list of holdings please contact your portfolio advisor.
Hobbs Wealth Management may discuss and display, charts, graphs, formulas, stock and sector picks which are not intended to be used by themselves to determine which securities to buy or sell, or when to buy or sell them. This specific information is limited and should not be used on their own to make investment decisions. This information is offered as educational only.