06/2025 Is it Already Over?
Full written article below with sources.
Disclaimer: Because of the increased regulation and compliance in the financial industry, I want to start with saying everything in this newsletter is based on my opinion and is not predictive in any way.
Before we get started, I want to share a good piece of personal news, from time to time I get nominated for different announcements. For those to subscribe to Bloomberg Businessweek, you’ll find a familiar name.

Disclosures listed below
Is the market volatility already over?
From February 19, 2025 to April 7, 2025 (intraday) the S&P 500 dropped over 21% (Source: Yahoo Finance). Keep in mind the AVERAGE calendar year decline since 1980 is 14.1%, source and image shown later in this newsletter.
So – to answer my own question, is the market volatility already over for 2025? When thinking about head-spinning and jaw dropping headlines, nope.
When thinking of current and future price volatility, nope.
We’re not out of the woods for 2025, not by a long stretch.
- Tariff rates and full impact are still widely unknown – along with the Manhattan based U.S. Court of International Trade trying to block or ban the proposed tariffs. Will you please raise your hand if you have ever heard of this U.S. Court before?
- Trump’s Reconciliation Bill has passed the House but is now under review and likely changes in the Senate.
- Moody’s downgraded the US government debt on May 16th to Aa1, which is the second highest rating, but still a downgrade: Source
- US Debt levels, and rising, along with reduced demand for longer-dated US bonds could be sign of broader concern over US debt levels: Reuters
Those above listed are just in the US, let’s not forget about Israel/Palestine, Ukraine/Russia, Taiwan/China, Iran’s nuclear ambitions, Syria’s new government, and many others.
But even with all these headlines and concerns, May 2025 was the best May since 1990: LPL.
As I see it, and I realize I may disappoint you, 2025 is just another year since 2000 where the S&P 500 has declined at least 20% or more in an intra-day basis. Other years are…
- 2000-02: Dot.com and WTC attacks
- 2007-09: Great Financial Recession
- 2011: US debt downgrade with European debt, and other economic concerns (be honest, did you remember 2011 and 2018?? Most don’t)
- 2018: Increasing interest rates, potential for a US-China trade war
- 2020: Covid pandemic
- 2022: High inflation with high interest rates
- 2025: Tariff concerns
Even with these seven cited downturns, would you be surprised to learn that if you invested 100k in the S&P 500 in January 2000 you’d now have close to 644k? What’s more the dividends and earnings continue to march higher. Sourced from: OfDollarsandData / S&P 500 at Your Fingertips

So when I harp on the idea that we MUST plan on the broad market going up and we MUST plan on the broad market going down, this is the idea.
As painful as 2025 has been, I wouldn’t be surprised if we see continued market volatility, price swings, and more unknowns.
Am I saying we’ll see another 20% or more move lower? No.
Am I saying we’ll see another 20% or more move higher? No.
I am saying that the market is likely to do what the market has done for over 100 years, be volatile.
But does that mean someone should change their allocation between stocks and bonds.
Well… that depends… if your financial plan and financial goals have changed, then yes, we’d very likely want to and potentially need to change your stock and bond allocation.
However, if your long-term goals have NOT changed, then no – you likely don’t need to change your allocation at all.
Why? Because long-term financial plans are just that, long-term. Just like every other historical market decline, the market has recovered and gone to new highs.
The current market volatility and price swings are not fun, but this is the way the market has performed for over 100 years. Historically, stocks are more volatile compared to bonds and historically, stocks have outperformed bonds. This idea is called the equity risk premium.
So what’s the plan? Continue to update your long-term financial plan and continue to adjust your portfolio with changing markets (this happens regularly for clients of Hobbs Wealth Management).
History Lesson: What’s the “average” intra-year market decline? I’m happy you asked, the average decline in any given year since 1980 is 14.1%. Year to date in 2025, we’ve experienced an over 20% decline. I’m hoping that’s it for the year!

Source: FactSet, Standard & Poor’s, J.P. Morgan Asset Management.
Returns are based on price index only and do not include dividends. Intra-year drops refers to the largest market drops from a peak to a trough during the year. For illustrative purposes only. Returns shown are calendar year returns from 1980 to 2024, over which the average annual return was 10.6%.
https://am.jpmorgan.com/us/en/asset-management/adv/insights/market-insights/guide-to-the-markets/
Additional Data: Each month I get asked by clients what additional resources I’m looking at. Please hear me in stating I’m not trying to predict anything whatsoever, just some of the interesting data I’m watching.
- Best and Worst Annualized Total Returns – investing historically favors the patient. Ask yourself - which is riskier? Holing Stocks or Holding Bonds over a 30 year period??? Peter Mallouk & Charlie Bilello

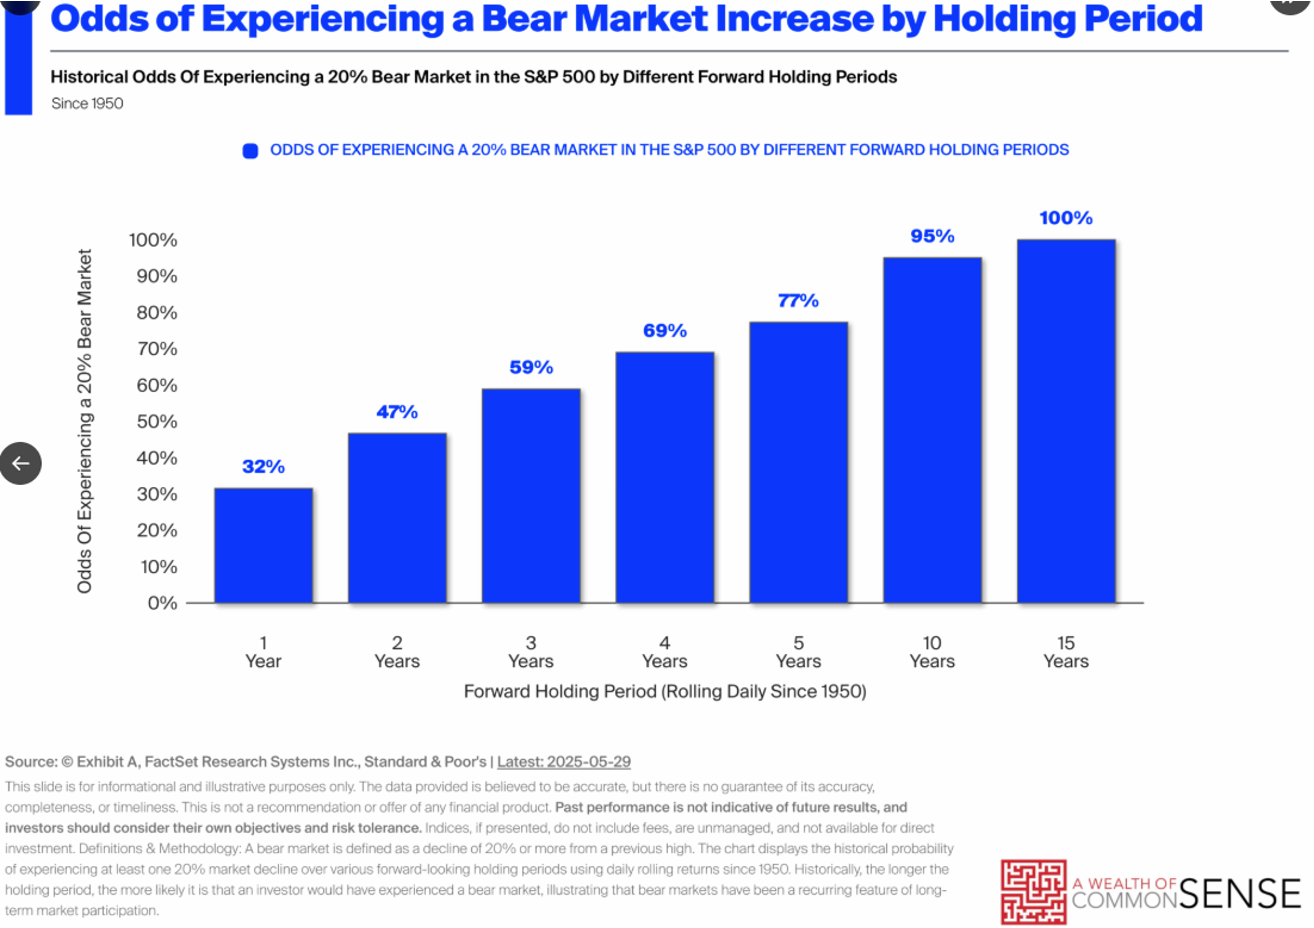
- It’s common to talk about the up-side potential as you increase your holding period, but it’s not has common to talk about or show the odds of experiencing a recession.

- Breakeven Inflation Rate - 5-Year Breakeven inflation rate is now 2.32%. When you study this chart, you’ll see it goes back to 2004.
- Federal Reserve Balance sheet – The Fed continues to follow through on it’s statement of reducing the balance sheet. We’re now down to $6.6T dollars in the balance sheet, last time we saw this was April 2020 levels and declining. Historically, the Fed’s balance sheet has been a good measure of Money Supply in this country which is typically tied to inflation.
- Debt Interest Payments – Most in this country would agree that the Federal Debt is just too high, but did you realize that the interest payments on this debt is now over 1.1 trillion a year? What should we do about it? My guess is we should balance the government budget…. But no one is asking me. What’s more, there’s about 3 Trillion in debt to be reissued in 2025 and the broad assumption is that the new interest rates will be quite a bit higher on the reissued debt. So what will this mean? It’ll likely mean even a greater about of debt interest payments.
The Bloomberg Listing was issued by Five Star Professional (FSP) for the time period 11/27/2024 through 05/01/2025. Fee paid for use of marketing materials. Self-completed questionnaire was used for rating. This rating is not related to the quality of the investment advice and based solely on the disclosed criteria. 1904 Indianapolis-area wealth managers were considered for the award; 133 (7 % of candidates) were named 2025 Five Star Wealth Managers. The following prior year statistics use this format: YEAR: # Considered, # Winners, % of candidates, Issued Date, Research Period. 2024: 1,650, 143, 9%, 9/1/24, 11/14/23 - 5/31/24; 2023: 1,594, 132, 8.28%, 9/1/23, 11/14/22 - 5/31/23; 2022: 1673, 131, 8%, 9/1/22, 12/27/21 - 6/24/22; 2021: 1716, 128, 7%, 9/1/21, 12/7/20 - 7/2/21; 2020: 1786, 143, 8%, 9/1/20, 12/2/19 - 6/12/20; 2019: 1659, 153, 9%, 9/1/19, 11/19/18 - 6/28/19; 2018: 1588, 149, 9%, 9/1/18, 12/28/17 - 7/23/18; 2017: 1164, 182, 16%, 9/1/17, 12/29/16 - 7/13/17; 2016: 1083, 332, 31%, 8/1/16, 1/15/16 - 7/21/16; 2015: 1743, 348, 20%, 9/1/15, 1/15/15 - 7/21/15; 2014: 2009, 360, 18%, 9/1/14, 1/15/14 - 7/21/14; 2013: 1624, 413, 25%, 9/1/13, 1/15/13 - 7/21/13; 2012: 1375, 387, 28%, 9/1/12, 1/15/12 - 7/21/12.
In closing: We of course cannot control what the market does from here and we cannot predict when the next market downturn will occur. But we can control our behavior to these outside events and continue to stick with our long-term investment strategy.
As always, if you have any questions/concerns please contact me.
David Hobbs, CFP®
Wealth Advisor | Owner
Hobbs Wealth Management
Past performance may not be indicative of future results. Investing in securities involves risks, including the potential for loss of principal. There is no guarantee that any investment plan or strategy will be successful.
**Case Study Disclosure** The case study presented is purely hypothetical and does not represent actual client results. This study is provided for educational purposes only. Similar, or even positive results, cannot be guaranteed. Each client has their own unique set of circumstances so products and strategies may not by suitable for all people. Please consult with a qualified professional before implementing any strategy discussed herein. No portion of this case study is to be interpreted as a testimonial or endorsement of the firms' investment advisory services.
Standard & Poor’s 500 (S&P 500) - a market-cap weighted index composed of the common stocks of 500 leading companies in leading industries of the U.S. economy.
Russell 2000 – The index measures the performance of the small-cap segment of the US equity universe. It is a subset of the Russell 3000 and includes approximately 2000 of the smallest securities based on a combination of their market cap and current index membership.
MSCI ACWI ex USA – The index measures the performance of the large and mid-cap segments of the particular regions, excluding USA equity securities, including developed and emerging market. It is free float-adjusted market-capitalization weighted.
Federal Funds Rate - refers to the target interest rate set by the Federal Open Market Committee (FOMC). This target is the rate at which commercial banks borrow and lend their excess reserves to each other overnight.
This report was prepared by Hobbs Wealth Management a State registered investment adviser under the Investment Advisers Act of 1940. Registration as an investment adviser does not imply a certain level of skill or training. The oral and written communications of an adviser provide you with information about which you determine to hire or retain an adviser. Neither the information nor any opinion expressed it so be construed as solicitation to buy or sell a security of personalized investment, tax, or legal advice. For more information please visit: https://adviserinfo.sec.gov/ and search for our firm name.
This newsletter is prepared to provide a degree of insight into the analysis used by Hobbs Wealth Management to make investment decisions. It is not a complete description of all factors used by Hobbs Wealth Management to make decisions on behalf of clients. The opinions included are not intended to be taken as fact, but are Hobbs Wealth Management’s interpretation of the impact of external events on investments.
The information herein was obtained from various sources. Hobbs Wealth Management does not guarantee the accuracy or completeness of information provided by third parties. The information in this report is given as of the date indicated and believed to be reliable. Hobbs Wealth Management assumes no obligation to update this information, or to advise on further developments relating to it.
This article contains external links directing you to a third-party website. Although we have reviewed the website prior to creating the link, we are not responsible for the content of the sites.
An index is an unmanaged portfolio of specific securities, the performance of which is often used as a benchmark in judging the relative performance of certain asset classes. Investors cannot invest directly in an index. An index does not charge management fees or brokerage expenses, and no such fees or expenses were deducted from the performance shown.
The mention of specific securities and sectors illustrates the application of our investment approach only and is not to be considered a recommendation. The specific securities identified and described herein do not represent all of the securities purchased or sold for the portfolio, and it should not be assumed that investment in these securities were or will be profitable. There is no assurance that the securities purchased remain in the portfolio or that securities sold have not been repurchased. For a complete list of holdings please contact your portfolio advisor.
Hobbs Wealth Management may discuss and display, charts, graphs, formulas, stock and sector picks which are not intended to be used by themselves to determine which securities to buy or sell, or when to buy or sell them. This specific information is limited and should not be used on their own to make investment decisions. This information is offered as educational only.