07/2025 Mid-Year Update
Full written article below with sources.
Disclaimer: Because of the increased regulation and compliance in the financial industry, I want to start with saying everything in this newsletter is based on my opinion and is not predictive in any way.
Twice a year I like to restate some of the core beliefs I encourage to follow. As usual, the first half of the year has been tumultuous. Specifically, the last quarter has been quite busy, more on this in a moment.
General Principles
- We are long-term, goal-focused, and plan-driven investors
- Creating broadly diversified portfolios is central to Investment Policy
- The economy cannot be consistently forecasted, and the markets cannot be timed. Because of this, the only practical way to capture the long-term, historic investment returns is to ride out the frequent, but historically short, market downturns. Put another way, there are no facts about the future.
- As your long-term financial goals change, so should your investment allocation. Or as Ben Carlson has said, and I’m para-phrasing… “More often than not, a change in your portfolio should occur because something changed in your life, not because something changed in the market’s life.”
2025 Q2 Comments
This past quarter has been dominated by tariffs, Israel/Iran and now recently the US bombing of nuclear facilities in Iran. I’m going to focus this newsletter on the events from April 2025 to current, highlighting volatility from tariffs and geopolitical tensions, including the U.S. bombing of Iran, and the market’s strength near record highs.
The broad stock market has historically always had turbulence and currently, the S&P 500 remains close to its peak. Which to me, based on my comments below show a strong amount of resilience.
1. Tariffs and Trade Tensions (April 2025) - On April 2, President Trump introduced steep tariffs “Liberation Day”, including 104% on Chinese imports, prompting China’s retaliatory tariffs on U.S. goods. Markets reacted sharply, with the Dow falling 2,200 points and the S&P 500 dropping 6% in its worst week since 2020. Overall, the broad market declined close to 18%.
Initial decline in the markets reflected fears of inflation and economic slowdown. However, by late April, stocks rebounded as tariff concerns eased, with the S&P 500 recovering significantly.
2. U.S. Irsael - Iran Conflict - On June 21, the U.S. and Israel conducted airstrikes on Iran’s nuclear facilities. I’m not sure about you, but as I watched the events unfold, I started to get a knot in my stomach. As of this writing on June 30th – it appears these concerns are largely over. I do hope and pray it stays this way.
The market’s impact to the bombing on June 21 was hardly noticed. Oil prices rose with Brent crude at $79.04, before falling to $71.48. The S&P 500 dipped 1.5% initially but stabilized. This was a very short-term blip.
3. Additional Market and Geopolitical Events
- Israel-Iran: Israel’s airstrikes caused oil to increase in price and de-stabilized the mid-east region
- Federal Reserve: The Fed maintained steady rates in June, it looks like we may get 1-2 rate cuts later in the year? I’m not sure about you but I’ve stopped holding my breath on any rate changes.
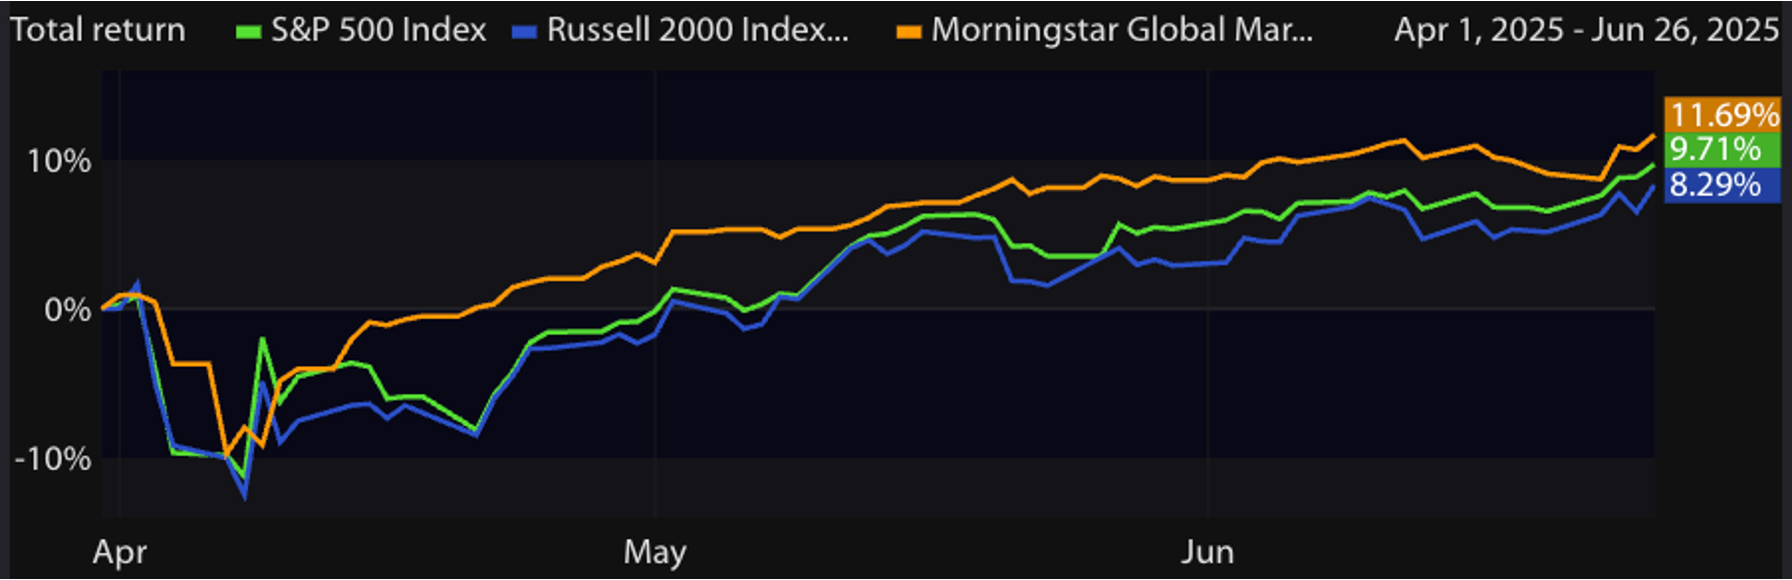
Let’s say you were living under a rock and I told you about all the above, you’d probably think the broad market would be down 10-20% or more!
Interestingly enough, since 4/1/2025 – 6/26/2025 the three broad market indexes are all in positive territory, source: Kwanti.com
History Lesson: What’s the “average” intra-year market decline? I’m happy you asked, the average decline in any given year since 1980 is 14.1%. Year to date in 2025, we’ve experienced an over 20% decline. I’m hoping that’s it for the year!

Source: FactSet, Standard & Poor’s, J.P. Morgan Asset Management.
Returns are based on price index only and do not include dividends. Intra-year drops refers to the largest market drops from a peak to a trough during the year. For illustrative purposes only. Returns shown are calendar year returns from 1980 to 2024, over which the average annual return was 10.6%.
https://am.jpmorgan.com/us/en/asset-management/adv/insights/market-insights/guide-to-the-markets/
Additional Data: Each month I get asked by clients what additional resources I’m looking at. Please hear me in stating I’m not trying to predict anything whatsoever, just some of the interesting data I’m watching.
- Coatue Management, LLC is an investment firm which recently hosted a conference in Los Angeles. Coatue has made some of the information available to the public. Recently, I’ve listened to several of the talks and want to share some of the information with you all. I’m going to highlight just a few of the slides. Please don’t read into the slides I’m highlighting as there are too many of interest. As you’ll see, Coatue is very optimistic on AI. Here’s the full slide deck for you to review: https://www.coatue.com/blog/company-update/coatues-2025-emw-conference
o Slide 6 – shows the US market cap since 1800 and how different industries dominated the US market over the years.
o Slide 15 – Looks at the Mag 7’s return over the last 5 years versus YTD
o Slide 24 – shows the monthly users of ChatGPT versus other social networks
o Slides 91 and 92 – shows the employee count at Microsoft and AppLovin (Digital Advertising) compared to annualized revenue

- Breakeven Inflation Rate - 5-Year Breakeven inflation rate is now 2.31%. When you study this chart, you’ll see it goes back to 2004.
- Federal Reserve Balance sheet – The Fed continues to follow through on it’s statement of reducing the balance sheet. We’re now down to $6.6T dollars in the balance sheet, last time we saw this was April 2020 levels and declining. Historically, the Fed’s balance sheet has been a good measure of Money Supply in this country which is typically tied to inflation.
- Debt Interest Payments – Most in this country would agree that the Federal Debt is just too high, but did you realize that the interest payments on this debt is now over 1.1 trillion a year? What should we do about it? My guess is we should balance the government budget…. But no one is asking me. What’s more, there’s about 3 Trillion in debt to be reissued in 2025 and the broad assumption is that the new interest rates will be quite a bit higher on the reissued debt. So what will this mean? It’ll likely mean even a greater about of debt interest payments.
- USA Facts – Someone sent me this video of Steve Ballmer, former CEO of Microsoft, explaining the US Federal Budget and Spending. He keeps his opinions out of this, and does a nice job of outlining the cash-flow of the US government. If you don’t feel as educated as you want to be on this subject, this 13 minute video will assist.
In closing: We of course cannot control what the market does from here and we cannot predict when the next market downturn will occur. But we can control our behavior to these outside events and continue to stick with our long-term investment strategy.
As always, if you have any questions/concerns please contact me.
David Hobbs, CFP®
Wealth Advisor | Owner
Hobbs Wealth Management
Past performance may not be indicative of future results. Investing in securities involves risks, including the potential for loss of principal. There is no guarantee that any investment plan or strategy will be successful.
**Case Study Disclosure** The case study presented is purely hypothetical and does not represent actual client results. This study is provided for educational purposes only. Similar, or even positive results, cannot be guaranteed. Each client has their own unique set of circumstances so products and strategies may not by suitable for all people. Please consult with a qualified professional before implementing any strategy discussed herein. No portion of this case study is to be interpreted as a testimonial or endorsement of the firms' investment advisory services.
Standard & Poor’s 500 (S&P 500) - a market-cap weighted index composed of the common stocks of 500 leading companies in leading industries of the U.S. economy.
Russell 2000 – The index measures the performance of the small-cap segment of the US equity universe. It is a subset of the Russell 3000 and includes approximately 2000 of the smallest securities based on a combination of their market cap and current index membership.
MSCI ACWI ex USA – The index measures the performance of the large and mid-cap segments of the particular regions, excluding USA equity securities, including developed and emerging market. It is free float-adjusted market-capitalization weighted.
Federal Funds Rate - refers to the target interest rate set by the Federal Open Market Committee (FOMC). This target is the rate at which commercial banks borrow and lend their excess reserves to each other overnight.
This report was prepared by Hobbs Wealth Management a State registered investment adviser under the Investment Advisers Act of 1940. Registration as an investment adviser does not imply a certain level of skill or training. The oral and written communications of an adviser provide you with information about which you determine to hire or retain an adviser. Neither the information nor any opinion expressed it so be construed as solicitation to buy or sell a security of personalized investment, tax, or legal advice. For more information please visit: https://adviserinfo.sec.gov/ and search for our firm name.
This newsletter is prepared to provide a degree of insight into the analysis used by Hobbs Wealth Management to make investment decisions. It is not a complete description of all factors used by Hobbs Wealth Management to make decisions on behalf of clients. The opinions included are not intended to be taken as fact, but are Hobbs Wealth Management’s interpretation of the impact of external events on investments.
The information herein was obtained from various sources. Hobbs Wealth Management does not guarantee the accuracy or completeness of information provided by third parties. The information in this report is given as of the date indicated and believed to be reliable. Hobbs Wealth Management assumes no obligation to update this information, or to advise on further developments relating to it.
This article contains external links directing you to a third-party website. Although we have reviewed the website prior to creating the link, we are not responsible for the content of the sites.
An index is an unmanaged portfolio of specific securities, the performance of which is often used as a benchmark in judging the relative performance of certain asset classes. Investors cannot invest directly in an index. An index does not charge management fees or brokerage expenses, and no such fees or expenses were deducted from the performance shown.
The mention of specific securities and sectors illustrates the application of our investment approach only and is not to be considered a recommendation. The specific securities identified and described herein do not represent all of the securities purchased or sold for the portfolio, and it should not be assumed that investment in these securities were or will be profitable. There is no assurance that the securities purchased remain in the portfolio or that securities sold have not been repurchased. For a complete list of holdings please contact your portfolio advisor.
Hobbs Wealth Management may discuss and display, charts, graphs, formulas, stock and sector picks which are not intended to be used by themselves to determine which securities to buy or sell, or when to buy or sell them. This specific information is limited and should not be used on their own to make investment decisions. This information is offered as educational only.