08/2025 Fed and Tariffs
Full written article below with sources.
Disclaimer: Because of the increased regulation and compliance in the financial industry, I want to start with saying everything in this newsletter is based on my opinion and is not predictive in any way.
2025 has been a wild ride!
Since the start of the year, the S&P 500 has been down close to 20% - then – since the lows in April, the market has ripped back higher about 23%. YTD, the S&P 500 is up a little over 6%. Source: Kwanti.com

This rally comes in the face of two major headwinds:
1. Federal Reserve holding interest rates steady at 4.25%–4.50%
2. New tariffs implemented across 2025
In this month’s newsletter, I want to try and articulate what explains the market’s resilience, and what lessons matter most for investors today?
Federal Reserve – This past month, the Federal Reserve decided to not change interest. This came with vitriol from some political offices. Regardless, typically when the Fed decides to not change rates this signals confidence in the underlying strength of the U.S. economy.
However – the Federal Reserve is hinting at a rate cut later this year (Fed Reserve notes). Additionally, it’ll be interesting to see who fills the role of recently resigned Fed Governor, Kugler. Keep in mind that whoever President Trump nominates, they have to get confirmed through the Senate.
But back to the Federal Reserve - corporate earnings remain robust, with the S&P 500 posting 5% year-over-year growth in the first quarter. Technology leaders like Nvidia and Microsoft, still benefitting from advances in artificial intelligence, have played a major role in driving market gains. Even with June’s CPI at 2.7%, the Fed remains cautious about cutting rates in the near future. Stable rates provide a solid base for equities but highlight—once again—the importance of diversification as different sectors respond in different ways. My personal take – Yes – I’d like to see interest rates come down; this would help economic activity, allow for housing refinances, and provide savings on the national debt. However – there is no way of knowing if it’s the right decision to cut interest rates or leave them as is. Because we can’t know the future, I’m OK with leaving the rates where they are to try and prevent an over-heating economy. Information sourced from: Mutualofamerica.com Kainz
Tariffs – While the information is still very new, we have a surprising trend in Import Prices. When the addition of Tariffs, one would assume that imported goods would increase in price, however, this hasn’t been the case. Prices for imported goods actually fell by 0.1% (PCE) and 0.76% (CPI) from December 2024 through May 2025, even as domestic goods prices inched higher or held steady. Part of the reason for the lower import prices has to do with lower energy costs and business flexibility in sourcing (especially shifting to non-tariff countries) have helped mute inflation pressures. Sourced from: Council of Econ Advisers.

To be fair, all this information is very early and I’m not putting much thought into this data point, but, this is all very promising.
What’s more, when you start to add in the trade deal with Japan and the $550 Billion investment in the US (CNN.com). Along with the trade deal with the EU, 15% import on EU goods and a 0% import of US goods to the EU, and the commitment to purchase $750 billion in US energy (EC Europa). The tariff situation is getting very interesting. This is something I’m watching very closely
So while 2025 has certainly been noisy, I don’t anticipate the noise to quiet down anytime soon. In fact, it looks like volatility is here to stay. Here are some take-aways from a recent post from Ben Carlson.
- Volatility is mean-reverting: This means Market swings don’t last forever and period of fear are historically followed my market opportunity
- Diversification is a wonderful defense: Using history as a guide, spreading investments across sectors and geographies keeps you in the market and exposes you to different sectors. No one knows the future.
o Whenever I make this statement, I’m reminded of the movie, The Big Short which told the story of Michael Burry shorting the market right before the Great Financial Crisis. Because in the moment, he was right. But… he’s been wrong a lot recently. In fact, Burry told investors to “Sell” on January 31, 2023, since then, the S&P 500 is up over 50% (he later regretted this post). Sourced: Barrons.com
- Behavior Discipline: While it’s nice to think we’re going to “out-smart the market” or “catch a falling knife” – history has shown that no one has been able to do this with any consistency. Because of this, there is a very real discipline to “staying the course.” In my experience, “staying the course” is difficult when the market is falling because I think… “let’s do something!!” – this is also difficult in rising markets because I think… “I’m missing out!” – History continues to show that consistent investing is a strategy that works through every season.
Additional Data: Each month I get asked by clients what additional resources I’m looking at. Please hear me in stating I’m not trying to predict anything whatsoever, just some of the interesting data I’m watching.
- - Annualized Real (after inflation) Total Returns – each time I see this information, it’s just startling to me how powerful broad market investing can to be to your overall wealth.

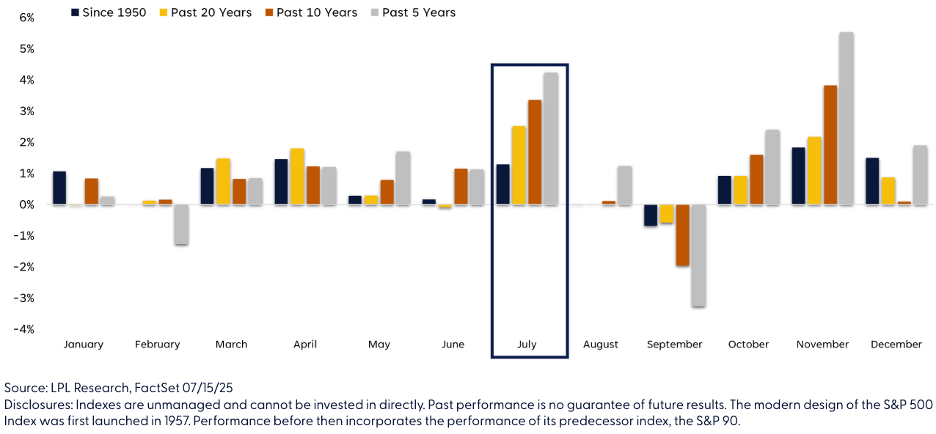
- Is it time to invest? This chart from LPL Financial shows historical returns, by month, for the last 70 years. As you’ll see in this chart, August and September are historically the two worst market return months. So should we go to cash? No. But I do want you to consider if now if the time to increase your investment contributions.
- Breakeven Inflation Rate - 5-Year Breakeven inflation rate is now 2.41%. When you study this chart, you’ll see it goes back to 2004.
- Debt Interest Payments – Most in this country would agree that the Federal Debt is just too high, but did you realize that the interest payments on this debt is now over 1.1 trillion a year? What should we do about it? My guess is we should balance the government budget…. But no one is asking me. What’s more, there’s about 3 Trillion in debt to be reissued in 2025 and the broad assumption is that the new interest rates will be quite a bit higher on the reissued debt. So what will this mean? It’ll likely mean even a greater about of debt interest payments.
- USA Facts – Someone sent me this video of Steve Ballmer, former CEO of Microsoft, explaining the US Federal Budget and Spending. He keeps his opinions out of this, and does a nice job of outlining the cash-flow of the US government. If you don’t feel as educated as you want to be on this subject, this 13 minute video will assist.
In closing: We of course cannot control what the market does from here and we cannot predict when the next market downturn will occur. But we can control our behavior to these outside events and continue to stick with our long-term investment strategy.
As always, if you have any questions/concerns please contact me.
David Hobbs, CFP®
Wealth Advisor | Owner
Hobbs Wealth Management
Past performance may not be indicative of future results. Investing in securities involves risks, including the potential for loss of principal. There is no guarantee that any investment plan or strategy will be successful.
**Case Study Disclosure** The case study presented is purely hypothetical and does not represent actual client results. This study is provided for educational purposes only. Similar, or even positive results, cannot be guaranteed. Each client has their own unique set of circumstances so products and strategies may not by suitable for all people. Please consult with a qualified professional before implementing any strategy discussed herein. No portion of this case study is to be interpreted as a testimonial or endorsement of the firms' investment advisory services.
Standard & Poor’s 500 (S&P 500) - a market-cap weighted index composed of the common stocks of 500 leading companies in leading industries of the U.S. economy.
Russell 2000 – The index measures the performance of the small-cap segment of the US equity universe. It is a subset of the Russell 3000 and includes approximately 2000 of the smallest securities based on a combination of their market cap and current index membership.
MSCI ACWI ex USA – The index measures the performance of the large and mid-cap segments of the particular regions, excluding USA equity securities, including developed and emerging market. It is free float-adjusted market-capitalization weighted.
Federal Funds Rate - refers to the target interest rate set by the Federal Open Market Committee (FOMC). This target is the rate at which commercial banks borrow and lend their excess reserves to each other overnight.
This report was prepared by Hobbs Wealth Management a State registered investment adviser under the Investment Advisers Act of 1940. Registration as an investment adviser does not imply a certain level of skill or training. The oral and written communications of an adviser provide you with information about which you determine to hire or retain an adviser. Neither the information nor any opinion expressed it so be construed as solicitation to buy or sell a security of personalized investment, tax, or legal advice. For more information please visit: https://adviserinfo.sec.gov/ and search for our firm name.
This newsletter is prepared to provide a degree of insight into the analysis used by Hobbs Wealth Management to make investment decisions. It is not a complete description of all factors used by Hobbs Wealth Management to make decisions on behalf of clients. The opinions included are not intended to be taken as fact, but are Hobbs Wealth Management’s interpretation of the impact of external events on investments.
The information herein was obtained from various sources. Hobbs Wealth Management does not guarantee the accuracy or completeness of information provided by third parties. The information in this report is given as of the date indicated and believed to be reliable. Hobbs Wealth Management assumes no obligation to update this information, or to advise on further developments relating to it.
This article contains external links directing you to a third-party website. Although we have reviewed the website prior to creating the link, we are not responsible for the content of the sites.
An index is an unmanaged portfolio of specific securities, the performance of which is often used as a benchmark in judging the relative performance of certain asset classes. Investors cannot invest directly in an index. An index does not charge management fees or brokerage expenses, and no such fees or expenses were deducted from the performance shown.
The mention of specific securities and sectors illustrates the application of our investment approach only and is not to be considered a recommendation. The specific securities identified and described herein do not represent all of the securities purchased or sold for the portfolio, and it should not be assumed that investment in these securities were or will be profitable. There is no assurance that the securities purchased remain in the portfolio or that securities sold have not been repurchased. For a complete list of holdings please contact your portfolio advisor.
Hobbs Wealth Management may discuss and display, charts, graphs, formulas, stock and sector picks which are not intended to be used by themselves to determine which securities to buy or sell, or when to buy or sell them. This specific information is limited and should not be used on their own to make investment decisions. This information is offered as educational only.