
Disclaimer: Because of the increased regulation and compliance in the financial industry, I want to start with saying everything in this newsletter is based on my opinion and is not predictive in any way. Also – I used AI to assist in rewriting my newsletter to reduce grammatical errors and to improve syntax.
Full written text listed below
If you’ve been watching the news lately, you’ve probably got a short list of reasons to feel uneasy.
Interest rates are high. Mortgages are back near ~7%. Inflation is still warmer than the Fed wants. Oil’s been sticky. Consumer confidence looks soft. And if you spend five minutes online, somebody’s ready to tell you artificial intelligence is either going to make us all rich… or end the species.
That’s a lot of noise for one month.
But before we treat this month’s list like the end of the world, it’s worth remembering: we’ve been here before. Over the last ~30 years, plenty of headlines felt like extinction-level events at the time. Here’s a top 5 list:
Y2K - computers were supposed to melt down at midnight
Dot-com crash — the “new economy” went to zero in people’s minds
9/11 — markets closed; it felt like the world had changed forever
Global Financial Crisis — the banking system nearly failed
COVID crash — the fastest bear market most of us have ever seen
Terrible historical event, all of this was real, I remember fear with some of these events. And yet — we’re still here. Over the years, the families that saved, invested, worked – those are the people who made progress through all of it.
With that said, let me re-focus on what’s driving the market now — interest rates and stocks — I want to expand on how these two are connected and why it matters to you.
Do rising rates kill the stock market?
Short answer: they can. They often matter. They don’t always.
The 10-year Treasury yield — what the government pays to borrow for 10 years, and a quiet driver of mortgage rates — has been hanging around / above ~5%. As of October 1, 2026, the 10 year is at 5.24% - the last time we saw a higher rate was May 2002, source.
When rates climb, two things tend to happen at once:
Borrowing costs more (home, car, business credit).
“Safer” bonds start competing harder with stocks for your investment dollars.
That’s why stocks have felt jumpy even when the big indexes are still near highs. Higher rates give the market an excuse to sell off.
If I disappeared for a few months and you told me rates were over 5%, I’d probably guess the broad market was down pretty hard. Well… it hasn’t been. The big indexes have been hanging around all-time high territory. That gap — “I’d expect X… but Y happened” — is exactly what the long-term data keeps reminding us.
Here’s ~60 years of it: S&P 500 total return (log scale — so you can see the path fairly) versus the U.S. 10-year yield. The reddish bands are the big equity drawdowns (total-return declines of about 19% or more).
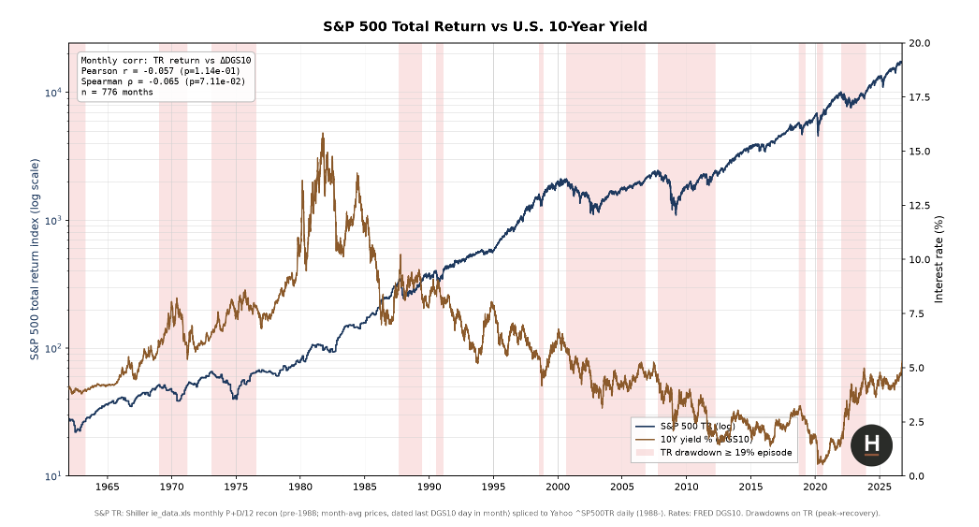
What jumps out from that chart?
1. Rates and stocks are related — but not locked together.
Over the full sample (~776 months), the monthly correlation between stock total returns and changes in the 10-year yield is only weakly negative. Plain English: if someone tells you “rates went up, so stocks must go down,” history doesn’t give them a blank check.
2. The relationship depends on the time-frame – great reminder there are no facts about the future.
1980–1999: more of the classic “rates up, stocks struggle” relationship (clearly negative)
2000–2009: actually positive — rates and stocks often moved together
2010–2019: strongly positive
2020–present: negative again (closer to the old story)
I’m not saying… “rates don’t matter.” Interest rate matter greatly to the broader economy. Mortgages, borrowing, how attractive bonds look versus stocks — that’s real life. I am saying that interest rates aren’t the entire story.
Earnings still do the heavy lifting
Long-term, stock prices are driven by earnings — companies making money over time.
Looking back on the last 25 years: from the early-2000s mess (tech crash, recession, 9/11, accounting scandals) the market went through a long stretch of bad events. And yet over the long run since then, the broad market has multiplied many times over — because corporate earnings grew. Dividends grew too.
I’m not telling you history guarantees the next decade. I’m saying the pattern of company earnings is stronger than the pattern of interest rates: companies work through and around the crisis of the day, be it higher interest rates, AI, Covid-19, etc...
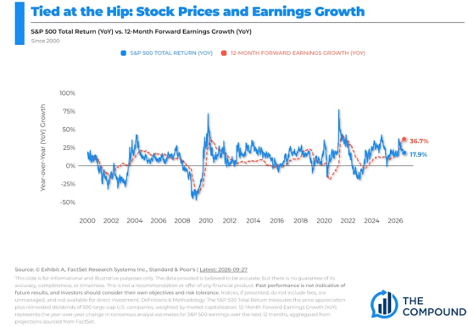
Consider this, over the past 25 years, the broad market is up about 8x. Now, take a guess about these same company earnings – the earnings are up about 9x in the same period. To me, that’s a strong correlation.
Forward earnings are up 36.7% and the S&P 500 is up 17.9% over the same period of time. I’m not saying to go all in, but I sure would be disappointed to not include this data point… the counter argument is that forward earnings are projected… yes… but the historical connection still applies
Practical Applications
If you’re thinking about how to navigate higher interest rates, here are some ideas.
Cash. If you’ve got money sitting around, make sure it’s earning a competitive rate. Sideline cash isn’t free anymore — in a good way.
Debt. If you’re financing something, higher rates will encourage you to pay it down sooner rather than later.
Portfolio noise. High rates can make the next decline feel “obvious” in hindsight. Declines happen anyway — in rising-and falling-rate regimes, as the chart shows. A long-term plan assumes rough patches. Reacting to each negative headline and staying invested through a plan are two different policies… Stay invested please…
What I’m not doing
I’m not calling a top. I’m not calling a melt-up. I’m not rearranging anybody’s life because the 10-year moved a few basis points this week.
I am paying attention. Rates certainly do matter. Earnings matter. More than any of these, behavior matters most.
Additional Data: Each month I get asked by clients what additional resources I’m looking at. Please hear me in stating I’m not trying to predict anything whatsoever, just some of the interesting data I’m watching.
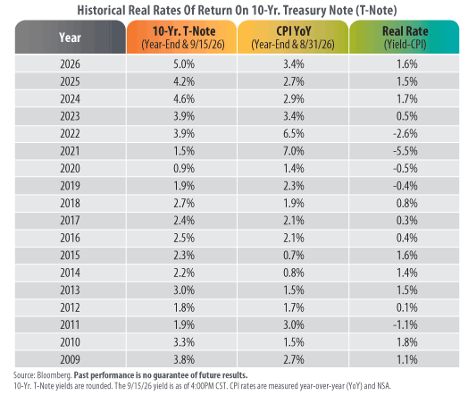
1. Inflation Adjusted Returns – Anytime we talk about investment returns, it’s always important to calculate the return amount above inflation. For example, if inflation was 3% and your investment earned 4%, well… you only gained a real 1% - make sense? With all the noise around current interest rates, I thought it’d be helpful to share a chart showing the real, inflation adjusted return of the 10-year treasury note… you’ll come to a similar conclusion… paltry returns at best…
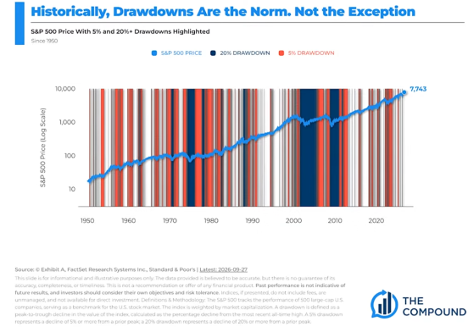
Would you buy this investment? 61% of the time, this investment is in a 5% or more drawdown, and this investment has been cut in half twice since 2000, would you buy this? Most don’t realize this is the painful reality of the S&P 500. Market declines are just part of the package.
A word on Politics - It’s already started and will surely heat up in the coming months. Here soon we will all be inundated with political information. It’s during moments like this that I like to remind myself and any reader about the ingenious outline of the American Constitutional framework. Namely, that every 4 years we elect a President, then 2 years later we get to elect the entire House of Representatives along with a third of the Senate (as a reminder they have staggered 6 year terms). Then to amend the Constitution, it take a two-thirds majority in both House of Congress along with support from three-fourths of the 50 states. I bring this up as an encouragement and defense against wild political swings in either direction.
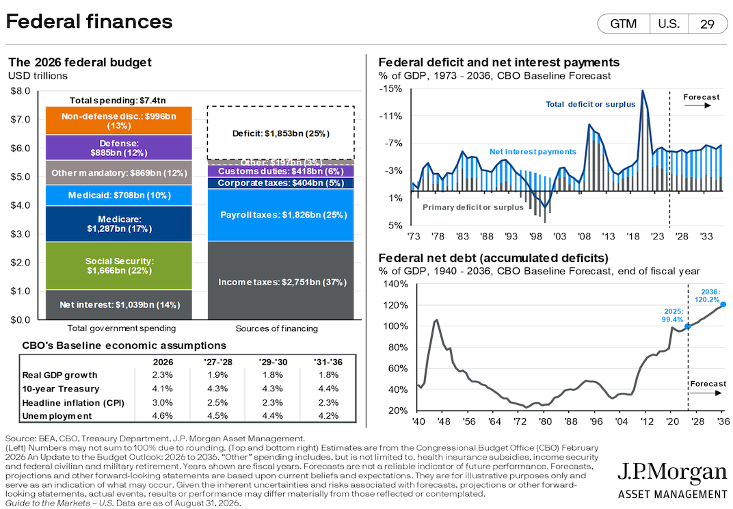
Debt Interest Payments – Most in this country would agree that the Federal Debt is just too high, but did you realize that the interest payments on this debt is now just over 1.3 trillion a year? What should we do about it? My guess is we should balance the government budget…. But no one is asking me.
In closing
We of course cannot control what the market does from here and we cannot predict when the next market downturn will occur. But we can control our behavior to these outside events and continue to stick with our long-term investment strategy.
As always, thank you for your trust, if you have any questions/concerns please contact me. If you found this useful, please share with someone you care about
-Dave
David Hobbs, CFP®
Wealth Advisor | Owner
Hobbs Wealth Management
Past performance may not be indicative of future results. Investing in securities involves risks, including the potential for loss of principal. There is no guarantee that any investment plan or strategy will be successful.
Standard & Poor’s 500 (S&P 500) - a market-cap weighted index composed of the common stocks of 500 leading companies in leading industries of the U.S. economy.
Russell 2000 – The index measures the performance of the small-cap segment of the US equity universe. It is a subset of the Russell 3000 and includes approximately 2000 of the smallest securities based on a combination of their market cap and current index membership.
MSCI ACWI ex USA – The index measures the performance of the large and mid-cap segments of the particular regions, excluding USA equity securities, including developed and emerging markets. It is free float-adjusted market-capitalization weighted.
Federal Funds Rate - refers to the target interest rate set by the Federal Open Market Committee (FOMC). This target is the rate at which commercial banks borrow and lend their excess reserves to each other overnight.
This report was prepared by Hobbs Wealth Management, a State registered investment adviser under the Investment Advisers Act of 1940. Registration as an investment adviser does not imply a certain level of skill or training. The oral and written communications of an adviser provide you with information about which you determine to hire or retain an adviser. Neither the information nor any opinion expressed it so be construed as solicitation to buy or sell a security of personalized investment, tax, or legal advice. For more information please visit: https://adviserinfo.sec.gov/ and search for our firm name.
This newsletter is prepared to provide a degree of insight into the analysis used by Hobbs Wealth Management to make investment decisions. It is not a complete description of all the factors used by Hobbs Wealth Management to make decisions on behalf of clients. The opinions included are not intended to be taken as fact but are Hobbs Wealth Management’s interpretation of the impact of external events on investments.
The information herein was obtained from various sources. Hobbs Wealth Management does not guarantee the accuracy or completeness of information provided by third parties. The information in this report is given as of the date indicated and is believed to be reliable. Hobbs Wealth Management assumes no obligation to update this information, or to advise on further developments relating to it.
This article contains external links directing you to a third-party website. Although we have reviewed the website prior to creating the link, we are not responsible for the content of the site.
An index is an unmanaged portfolio of specific securities, the performance of which is often used as a benchmark in judging the relative performance of certain asset classes. Investors cannot invest directly in an index. An index does not charge management fees or brokerage expenses, and no such fees or expenses were deducted from the performance shown.
The mention of specific securities and sectors illustrates the application of our investment approach only and is not to be considered a recommendation. The specific securities identified and described herein do not represent all of the securities purchased or sold for the portfolio, and it should not be assumed that investment in these securities was or will be profitable. There is no assurance that the securities purchased remain in the portfolio, or that securities sold have not been repurchased. For a complete list of holdings, please contact your portfolio advisor.
Hobbs Wealth Management may discuss and display charts, graphs, formulas, stock and sector picks which are not intended to be used by themselves to determine which securities to buy or sell, or when to buy or sell them. This specific information is limited and should not be used on their own to make investment decisions. This information is offered as educational only.